My work develops structural macroeconomic models along three lines of research. The first concerns the mechanisms through which monetary and fiscal policy shocks are transmitted in an open economy. The second examines how external shocks reshape saving behaviour, the external balances and the policy space available to the authorities. The third analyses the macroeconomic implications of demographic transitions. These questions are taken to the data for advanced economies as well as for resource-dependent economies.
Mes travaux développent des modèles macroéconomiques structurels articulés autour de trois axes de recherche. Le premier porte sur les mécanismes de transmission des chocs de politique monétaire et budgétaire en économie ouverte. Le deuxième examine la manière dont les chocs externes reconfigurent le comportement d’épargne, les soldes extérieurs et l’espace de politique économique dont disposent les autorités. Le troisième analyse les implications macroéconomiques des transitions démographiques. Ces questions font l’objet d’applications empiriques portant sur les économies avancées ainsi que sur les économies tributaires des ressources naturelles.
AboutÀ propos
BiographyBiographie
I am an economist working at the meeting point of three fields: macroeconomics, computational economics and mathematical economics. Macroeconomics supplies the questions, computational economics the means of answering them once the models stop admitting closed-form solutions, and mathematical economics the discipline that keeps the answers well posed. The combination is what allows me to move between a theoretical model, its numerical resolution and an estimate taken to the data without changing craft along the way.
Je suis économiste et je travaille au point de rencontre de trois champs : la macroéconomie, l’économie computationnelle et l’économie mathématique. La macroéconomie fournit les questions, l’économie computationnelle les moyens d’y répondre lorsque les modèles cessent d’admettre une solution analytique, et l’économie mathématique la rigueur qui garde les réponses bien posées. Cette combinaison me permet de passer d’un modèle théorique à sa résolution numérique puis à une estimation confrontée aux données sans changer de métier en chemin.
I am a visiting professor at the Université Officielle de Bukavu and the Université Évangélique en Afrique, where I teach computable general equilibrium modelling. In Quebec, I am a lecturer in the Department of Economics and Administration at the Université du Québec à Chicoutimi, and a research professional in macroeconomics at CIRANO and at the Chair in Macroeconomics and Forecasting of UQAM.
Je suis professeur visiteur à l’Université Officielle de Bukavu ainsi qu’à l’Université Évangélique en Afrique, où j’enseigne la modélisation en équilibre général calculable. Au Québec, je suis chargé de cours au Département d’économie et d’administration de l’Université du Québec à Chicoutimi et professionnel de recherche en macroéconomie au CIRANO et à la Chaire de recherche en macroéconomie de l’UQAM.
TrainingParcours universitaire
My training followed that same three-field path. I read for a B.Sc. in mathematical economics at the University of Kinshasa, completed in 2011, then an M.A. in economics at Université Laval between 2012 and 2014 under Benoît Carmichael and Kevin Moran. A Poler-Oxford award took me to the University of Oxford in 2016 for an M.Sc. in economics for development, supervised by Christopher Adam. I returned to Université Laval for a doctorate in macroeconomics under Kevin Moran, defended in 2025, and I am completing an M.Sc. in mathematical and computational finance at the Université de Montréal under Fabian Bastin. Along the way I spent a summer at the Becker Friedman Institute of the University of Chicago on heterogeneous-agent models with Ben Moll and Greg Kaplan, and took certificates in applied computational economics at McGill and in machine learning applied to finance and insurance at the Université de Montréal. The full record is under the Education tab.
Ma formation a suivi ce même parcours en trois champs. J’ai obtenu un B.Sc. en économie mathématique à l’Université de Kinshasa en 2011, puis un M.A. en économique à l’Université Laval entre 2012 et 2014, sous la direction de Benoît Carmichael et de Kevin Moran. Une bourse Poler-Oxford m’a conduit à l’Université d’Oxford en 2016 pour un M.Sc. en économie du développement, dirigé par Christopher Adam. Je suis revenu à l’Université Laval pour un doctorat en macroéconomie sous la direction de Kevin Moran, soutenu en 2025, et je termine un M.Sc. en finance mathématique et computationnelle à l’Université de Montréal sous la direction de Fabian Bastin. J’ai par ailleurs passé un été au Becker Friedman Institute de l’Université de Chicago sur les modèles à agents hétérogènes, avec Ben Moll et Greg Kaplan, et obtenu des certificats en économie computationnelle appliquée à McGill et en apprentissage automatique appliqué à la finance et à l’assurance à l’Université de Montréal. Le détail figure sous l’onglet Formation.
Applied and policy workTravaux appliqués et mandats publics
A good part of my work has been done inside public institutions, where a model has to answer a question that someone is waiting on. As a macroeconomic consultant in the DR Congo between 2016 and 2017, I built the 2013 social accounting matrix and a dynamic computable general equilibrium model to analyse the effect of public spending on growth. Between 2014 and 2015, I developed a macroeconomic model simulating the impact of agricultural investment on growth. Both mandates grew out of the Groupe MEGC at the University of Kinshasa, whose social accounting matrix for the country underlies my work on regional integration, trade liberalisation, agricultural investment and poverty reduction.
Une bonne part de mes travaux s’est faite à l’intérieur d’institutions publiques, là où un modèle doit répondre à une question que quelqu’un attend. Comme consultant macroéconomiste en RD Congo entre 2016 et 2017, j’ai élaboré la matrice de comptabilité sociale de 2013 et un modèle d’équilibre général calculable dynamique afin d’analyser l’impact des dépenses publiques sur la croissance. Entre 2014 et 2015, j’ai développé un modèle macroéconomique simulant l’impact des investissements agricoles sur la croissance. Ces deux mandats sont nés du Groupe MEGC de l’Université de Kinshasa, dont la matrice de comptabilité sociale sous-tend mes travaux sur l’intégration régionale, la libéralisation commerciale, l’investissement agricole et la réduction de la pauvreté.
How the work is organisedL’organisation du travail
Macroeconomics has two sides, and I work on both. On the theoretical side, I build DSGE and overlapping-generations models to trace how households, policy and external constraints interact over the life cycle. On the empirical side, I take those mechanisms to the data with panel and time-varying-parameter methods. Each side informs the other, since a model indicates which correlations should appear in the data, and the estimates then discipline the next model.
La macroéconomie a deux versants, et je travaille sur les deux. Du côté théorique, je construis des modèles DSGE et à générations imbriquées pour suivre l’interaction entre les ménages, la politique économique et les contraintes extérieures sur le cycle de vie. Du côté empirique, je confronte ces mécanismes aux données par des méthodes de panel et à paramètres variables dans le temps. Chaque versant éclaire l’autre, puisque le modèle indique quelles corrélations devraient apparaître dans les données et que les estimations disciplinent ensuite le modèle suivant.
Within those three lines, five strands organise the work. The first is monetary and fiscal policy, where I ask how the policy rate and the public budget transmit to output, prices and the external accounts, and what limits that transmission once an economy is open to trade and to global financial conditions. The second looks at small open economies under partial dollarization, using the Democratic Republic of the Congo as a working laboratory for how external monetary shocks travel through exchange rates, commodity prices and reserves. The third, which carries most of my recent papers, is the macroeconomics of demographic change: how ageing, longevity, fertility and international migration move saving, growth and external balances, studied in life-cycle and overlapping-generations models and in regional panel data. The fourth concerns financial factors in macroeconomic modelling and the welfare costs of inflation, the subject of my work on markups and trend inflation. The fifth, and the longest-running, applies computable general equilibrium analysis to the Congolese economy.
Au sein de ces trois axes, cinq volets organisent le travail. Le premier porte sur les politiques monétaire et budgétaire : j’examine comment le taux directeur et le budget public se transmettent à la production, aux prix et aux comptes extérieurs, et ce qui limite cette transmission dès lors qu’une économie s’ouvre aux échanges et aux conditions financières mondiales. Le deuxième concerne les petites économies ouvertes partiellement dollarisées, avec la République démocratique du Congo comme laboratoire pour comprendre la transmission des chocs monétaires externes par les taux de change, les prix des matières premières et les réserves. Le troisième, qui réunit la plupart de mes travaux récents, est la macroéconomie des changements démographiques, soit l’effet du vieillissement, de la longévité, de la fécondité et des migrations internationales sur l’épargne, la croissance et les soldes extérieurs, étudié dans des modèles à cycle de vie et à générations imbriquées et sur des données de panel régionales. Le quatrième traite des facteurs financiers dans la modélisation macroéconomique et des coûts en bien-être de l’inflation, objet de mes travaux sur les markups et la tendance inflationniste. Le cinquième, le plus ancien, applique l’analyse en équilibre général calculable à l’économie congolaise.
Research fieldsDomaines de recherche
EconomicsÉconomie
Monetary and fiscal policyPolitique monétaire et politique budgétaire
International macroeconomicsMacroéconomie internationale
Macroeconomics of demographic changeMacroéconomie des changements démographiques
Financial factors in macroeconomic modellingFacteurs financiers dans la modélisation macroéconomique
Costs of inflationCoûts de l’inflation
MacroeconometricsMacroéconométrie
Computable general equilibrium modellingModélisation en équilibre général calculable
Public policy evaluationÉvaluation des politiques publiques
2018 2025Ph.D. in Economics, macroeconomicsDoctorat en économique, macroéconomieUniversité LavalSupervisor Kevin MoranDirection Kevin Moran
2019M.Sc. in Mathematical and Computational FinanceM.Sc. en finance mathématique et computationnelleUniversité de MontréalIn progress. Supervisor Fabian BastinEn cours. Direction Fabian Bastin
2016 2017M.Sc. in Economics for DevelopmentM.Sc. en économie du développementUniversity of OxfordSupervisor Christopher AdamDirection Christopher Adam
2011B.Sc. in Mathematical EconomicsB.Sc. en économie mathématiqueUniversité de KinshasaSupervisor A. KamiantakoDirection A. Kamiantako
Advanced trainingFormation complémentaire
2019Becker Friedman Institute summer school, University of ChicagoÉcole d’été du Becker Friedman Institute, University of ChicagoMacroeconomics and heterogeneous-agent (HANK) models, with Ben Moll and Greg KaplanMacroéconomie et modèles à agents hétérogènes (HANK), avec Ben Moll et Greg Kaplan
2019Applied computational economics, McGill UniversityÉconomie computationnelle appliquée, McGill University
2013Dynamic impacts of macroeconomic policies and shocksImpacts dynamiques des politiques et des chocs macroéconomiquesCertificate, Université LavalCertificat, Université Laval
2023Machine learning applied to finance and insuranceApprentissage automatique appliqué à la finance et à l’assuranceCertificate, Université de MontréalCertificat, Université de Montréal
Awards and scholarshipsBourses et distinctions
2025Chair in Macroeconomics and Forecasting scholarshipBourse de la Chaire en macroéconomie et prévisionsChaire en macroéconomie et prévisions, ESG UQAMChaire en macroéconomie et prévisions, ESG UQAM
2023Georges-Henri-Lévesque doctoral completion scholarshipBourse de fin d’études de doctorat du Fonds Georges-Henri-LévesqueUniversité Laval, awarded for academic record and thesis relevanceUniversité Laval, pour le dossier académique et la pertinence de la thèse
2022NSERC-CREATE Fin-ML programmeProgramme NSERC-CREATE Fin-MLMachine learning in quantitative finance and business analytics, Université de MontréalApprentissage automatique en finance quantitative, Université de Montréal
2021Doctoral excellence scholarshipBourse d’excellence au doctoratCRREP, Université LavalCRREP, Université Laval
2020MITACS Ph.D. research scholarshipBourse de recherche doctorale MITACSMITACSMITACS
2020Doctoral excellence scholarshipBourse d’excellence au doctoratCRREP, Université LavalCRREP, Université Laval
2019Tadek Matuszewski scholarshipBourse Tadek MatuszewskiDepartment of Economics, Université LavalDépartement d’économique, Université Laval
2019Five-year doctoral scholarshipBourse doctorale de cinq ansDepartment of Economics, Université LavalDépartement d’économique, Université Laval
2019Ph.D. student mobility scholarshipBourse de mobilité doctoraleDepartment of Economics and Becker Friedman Institute, University of ChicagoDepartment of Economics et Becker Friedman Institute, University of Chicago
2018Ph.D. fellowshipBourse de doctoratDepartment of Economics, Université LavalDépartement d’économique, Université Laval
2016Poler-Oxford scholarshipBourse Poler-OxfordUniversity of Oxford, merit award covering fees and living costsUniversity of Oxford, bourse au mérite couvrant les droits et les frais de subsistance
2014My Thesis in 180 Seconds prizePrix « Ma thèse en 180 secondes »Faculté des sciences sociales, Université LavalFaculté des sciences sociales, Université Laval
2014CIRPÉE prize for the best master’s thesisBourse d’excellence CIRPÉE du meilleur mémoire de maîtriseCIRPÉE, Université LavalCIRPÉE, Université Laval
2011MEXT scholarshipBourse MEXTEmbassy of Japan in the DR Congo, awarded by competitionAmbassade du Japon en RD Congo, sur concours
The two files are typeset from a single LaTeX source and carry the same entries; they were last revised in August 2026.Les deux fichiers sont composés à partir d’une même source LaTeX et portent les mêmes entrées ; ils ont été révisés en août 2026.
NewsActualités
Latest newsDernières actualités
October 2026Octobre 2026
New working paper on SSRNNouveau document de travail sur SSRN
I am on the academic job market during the 2026–2027 hiring cycle. My CV is available under the About section; my research statement, teaching statement and other application materials are available on request.
Je suis sur le marché de l’emploi académique pour le cycle de recrutement 2026–2027. Mon CV est disponible sous la rubrique À propos ; mon exposé de projet de recherche, mon exposé de philosophie d’enseignement et mes autres documents de candidature sont disponibles sur demande.
September 2026Septembre 2026
Papers submitted to peer-reviewed journalsArticles soumis à des revues avec comité de lecture
The following papers are now under review:
Les articles suivants sont désormais en révision :
Titles marked “Submitted” on the Research page link to the working paper and abstract.
Les titres marqués « Soumis » sur la page Recherche renvoient au texte de travail et au résumé.
September 2026Septembre 2026
Revised working paper posted on SSRNTexte de travail révisé mis en ligne sur SSRN
A revised version of “Artificial Intelligence, Aging, and the Macroeconomy” is now available on SSRN (IDEAS); see the abstract on the Research page.
Une version révisée de « Artificial Intelligence, Aging, and the Macroeconomy » est disponible sur SSRN (IDEAS) ; le résumé figure sur la page Recherche.
—
Conferences and presentationsConférences et présentations
Upcoming conference presentations, seminars and workshop participations will be announced here as they are confirmed.
Les présentations à venir, séminaires et participations à des ateliers ou conférences seront annoncés ici au fur et à mesure de leur confirmation.
ResearchRecherche
Abstracts appear in the language of the paper. Citation counts come from Les résumés sont présentés dans la langue de l’article. Les comptes de citations proviennent de Google Scholar..
This paper studies artificial intelligence and rising longevity together, in a life-cycle general equilibrium model with endogenous fertility in which firms accumulate physical and AI capital. Two results do not depend on the elasticity of substitution between labor and AI. The first is that the stationary equilibrium cannot identify it. Holding the AI income share fixed, fertility, hours, the labor share and every rate of return are invariant to that elasticity, and every level is proportional to a single composite, so a cross-section is consistent with complementarity and with perfect substitutability alike. Only the dynamics separate the two, and we solve the model under both. The second is that the elasticity at which automation begins to depress wages lies strictly below the partial-equilibrium threshold of the task-based literature, falling from 3.03 to 1.99 once the capital stock is free to adjust. The young save out of labor income, so a wage-depressing technology contracts the base of capital supply and the adjustment of capital works against the wage rather than for it. The baseline elasticity of two therefore lies just above the crossing, and its long-run wage effect, an elasticity of −0.0015, is too small to sign at the baseline AI income share. At the smaller shares the national accounts support, it is negative. The two disturbances are then mirror images acting on that same price, AI shifting capital demand and longevity capital supply, with opposite imprints on returns and on fertility. Fertility tracks the erosion of the labor share through a coefficient we prove is invariant to the elasticity, so its own knife-edge is the Cobb–Douglas case rather than the wage threshold. The evidence does not settle its sign, which turns on one object rather than on a list of conditions. The direction of skill bias fixes the sign of the labor-share response, through the share of labor income the complemented type earns, and fixes through the same term the sign of the quantity–quality response. The two offset rather than compound, so the fertility response is negative under the direction the equipment–skill estimates imply and positive under the direction the generative-AI field evidence implies. The sign rests in addition on two features of the environment, a positive pure-profit share and its accrual to the working-age generation. We locate these rather than assume them.
This paper examines the transmission of external monetary disturbances in a highly dollarized small open economy, using the Democratic Republic of Congo as a representative case. We develop a tractable open-economy model with partial dollarization, incomplete price adjustment and an endogenous risk premium linked to interest rate differentials. Simulations indicate that a U.S. interest rate tightening generates an immediate and persistent depreciation of the domestic currency, alongside rising risk premia and inflationary pressure. Money supply shocks amplify exchange rate and price responses under dollarization as real money demand weakens, while risk premium shocks add volatility through expectation-driven dynamics. Across shock types, domestic monetary policy has limited capacity to offset external disturbances. Dollarization changes how shocks spread, since it reduces policy independence and magnifies the weight of global financial conditions, so stabilization requires tools beyond the interest rate.
This paper explores the dynamic effects of U.S. monetary tightening on macroeconomic and financial conditions in the Democratic Republic of Congo, a small, resource-dependent and partially dollarized economy. Using a time-varying parameter vector autoregression (TVP-VAR), the study traces the responses of the Congolese franc, copper prices, inflation, broad money and international reserves to an unexpected increase in the U.S. policy rate in January 2019, which coincided with a new political regime. The initial shock induces currency depreciation, a decline in copper prices, short-term disinflation, a contraction in M2 and a fall in reserves. Later dynamics include delayed appreciation, recovery in copper prices and adjustment in monetary aggregates, pointing to compensatory capital flows, export revenues and central bank intervention. The results show how exposed the country is to external financial shocks, how much weight domestic monetary and exchange rate policy carries, and how political regime shifts affect the propagation of those shocks.
This paper develops a two-country, open-economy quantitative model to analyse the macroeconomic implications of demographic shifts such as population ageing, declining population growth, increased longevity and international migration. The model builds on the overlapping-generations framework of Gertler (1999), with young and old households in each country, and calibrates entry, retirement and exit rates to observed population growth, retirement ages and life expectancy. It accommodates differential population growth across countries, migration from developing to developed economies, divergent productivity and imperfect global financial integration. Simulations focus on how ageing, migration and productivity differences affect net exports and the current account in two regions representing the global North and the global South. Demographic trends emerge as a main driver of aggregate savings and external balances. Demographic shocks produce trade and current account surpluses in the North, while productivity differences shape investment patterns across regions.
This paper presents an empirical analysis of how global demographic change and international migration affect external balances, grouping countries into advanced, emerging and developing economies and proceeding region by region. Panel models estimate the impact of one demographic factor at a time, whether ageing, fertility, life expectancy or immigration, on one macroeconomic aggregate at a time, such as consumption, savings, investment, the trade balance or the current account. Larger shares of older adults weigh on the trade balance in advanced and emerging economies. Ageing is associated with lower savings rates and current account ratios in emerging and developing economies, while in advanced economies savings tend to rise with life expectancy, ageing and net migration. Net immigration raises savings rates in advanced economies and investment in emerging and developing ones. Regional conditioning matters, since all regions face demographic change but not at the same scale.
This paper analyses empirically how global demographic change affects GDP growth, region by region across advanced, emerging and developing economies. A decomposition of per capita GDP growth shows that hourly productivity and total hours worked drive growth in advanced economies, while hourly productivity and an expanding working-age population matter most in emerging economies. Falling hours per job have weighed on per capita growth in advanced economies. Panel estimates then take one demographic factor at a time. Larger shares of older adults raise per capita growth in emerging and developing economies but reduce it in advanced ones. Shifts in the working-age population raise per capita GDP across all groups, while a larger youth share lowers it. Net immigration raises per capita growth in advanced and developing economies and lowers it in emerging ones. The macroeconomic consequences of demographic shifts therefore depend on the stage of development.
Cited by 2Cité 2 fois
Working paperDocument de travail2023
Working paper, 2023Document de travail, 2023
Fertility Decisions, International Migration, Remittances, and Global Imbalances in a Two-Country Life-Cycle Economy
Single-authoredAuteur unique
Using a two-country life-cycle framework with endogenous fertility and remittances, this paper investigates how positive longevity, immigration and productivity shocks affect external imbalances in the North and the South. Positive demographic and productivity shocks improve the North’s trade balance, with demographic shocks the primary driver, followed by productivity, immigration and longevity. Rising productivity and immigration in the North lower the South’s trade balance, while a longevity shock in the North raises it. Longevity, immigration and productivity shocks drive the negative dynamics of the North’s current account, whereas demographic shocks improve the South’s net foreign asset position and current account. Higher longevity in the North raises the old-age dependency ratio, net migration and the fertility of foreign-born workers. Higher immigration raises foreign-born fertility and population growth while lowering native-born fertility. A positive productivity shock lowers fertility, population growth and the old-age dependency ratio.
Earlier work in macroeconomics and monetary policyTravaux antérieurs en macroéconomie et en politique monétaire
2015Markups, trend positif d’inflation et coûts en bien-êtreWelfare costs of trend inflation in a New Keynesian model, with price and wage markups. With J.B. Nlemfu Mukoko.Coûts en bien-être d’une inflation tendancielle dans un modèle néo-keynésien, avec markups de prix et de salaires. Avec J.B. Nlemfu Mukoko.
2012Croissance schumpétérienne et taxe sur la pollutionSchumpeterian growth with a pollution tax, building on Aghion and Howitt. With J.B. Nlemfu Mukoko.Croissance schumpétérienne et taxation de la pollution, à partir des travaux d’Aghion et Howitt. Avec J.B. Nlemfu Mukoko.
Earlier work on general equilibrium and the Congolese economyTravaux antérieurs sur l’équilibre général et l’économie congolaise
Applied CGE and social accounting work carried out with the Groupe MEGC, Department of Economics, University of Kinshasa. Working papers are archived on MPRA and indexed on RePEc.Travaux appliqués en équilibre général calculable et en comptabilité sociale menés avec le Groupe MEGC, Département d’économie, Université de Kinshasa. Les documents de travail sont archivés sur MPRA et indexés sur RePEc.
2011Une matrice de comptabilité sociale pour la R.D. Congo, MCS-RDC2005A 2005 social accounting matrix built on the 1993 System of National Accounts. With J.B. Nlemfu Mukoko.Matrice de comptabilité sociale 2005 fondée sur le Système de comptabilité nationale de 1993. Avec J.B. Nlemfu Mukoko.Cited by 8Cité 8 fois
Undergraduate and graduate teaching at the University of Kinshasa, Université Officielle de Bukavu, Université Évangélique en Afrique, Université du Québec à Chicoutimi, Université Laval and Université Soumaré. Questions about course content are welcome by email.
Enseignement de premier et de deuxième cycle à l’Université de Kinshasa, à l’Université Officielle de Bukavu, à l’Université Évangélique en Afrique, à l’Université du Québec à Chicoutimi, à l’Université Laval et à l’Université Soumaré. Toute question sur le contenu des cours est bienvenue par courriel.
Visiting appointments in DR CongoProfessorats visiteurs en RD Congo
MEGC
Computable General Equilibrium ModelsModèles d’équilibre général calculableUniversité Officielle de Bukavu, graduateUniversité Officielle de Bukavu, deuxième cycle
Building, calibrating and solving CGE models, covering social accounting matrices, closure rules and the simulation of trade, tax and public spending reforms.
Construction, calibration et résolution de modèles d’équilibre général calculable, avec les matrices de comptabilité sociale, les règles de bouclage et la simulation de réformes commerciales, fiscales et budgétaires.
MEGC
Computable General Equilibrium Models and OptimisationModèles d’équilibre général calculable et optimisationUniversité Évangélique en Afrique, graduateUniversité Évangélique en Afrique, deuxième cycle
CGE modelling together with the optimisation methods that underpin it, including constrained optimisation, duality and the numerical solution of large equilibrium systems.
La modélisation en équilibre général calculable et les méthodes d’optimisation qui la fondent, dont l’optimisation sous contrainte, la dualité et la résolution numérique de grands systèmes d’équilibre.
Université du Québec à Chicoutimi, September 2023 to presentUniversité du Québec à Chicoutimi, septembre 2023 à aujourd’hui
2ECO102
The Economic Environment of the FirmEnvironnement économique de l’entrepriseDepartment of Economics and Administration, undergraduate, 3 creditsDépartement d’économie et d’administration, premier cycle, 3 créditsTaught in fall 2023, winter 2024 and fall 2024.Donné à l’automne 2023, à l’hiver 2024 et à l’automne 2024.
Core concepts and competing theories of aggregate behaviour, the transmission channels of monetary and fiscal policy, and the choice of policy to stabilise unemployment and inflation.
Les concepts fondamentaux et les théories concurrentes du comportement des agrégats, les canaux de transmission des politiques monétaire et budgétaire, et le choix des politiques de stabilisation du chômage et de l’inflation.
2ECO205
Managerial EconomicsÉconomie managérialeDepartment of Economics and Administration, undergraduate, 3 creditsDépartement d’économie et d’administration, premier cycle, 3 créditsTaught in winter 2024, fall 2024 and fall 2025.Donné à l’hiver 2024, à l’automne 2024 et à l’automne 2025.
Individual decision-making in a market environment, aimed at students who will use economic reasoning in management roles.
La décision individuelle dans un environnement de marché, pour des étudiants appelés à mobiliser le raisonnement économique en gestion.
2ECO600
International EconomicsÉconomie internationaleM.Sc. in Organisation Management, graduate, 3 creditsMaîtrise en gestion des organisations, deuxième cycle, 3 créditsTaught in winter 2025.Donné à l’hiver 2025.
International exchange of goods, services, capital, migrants and currencies. The course covers the role of international organisations, regional agreements, monetary unions and multinational firms, with an emphasis on trade policy.
Les échanges internationaux de biens, de services, de capitaux, de migrants et de devises. Le cours traite du rôle des organisations internationales, des accords régionaux, des unions monétaires et des firmes multinationales, en insistant sur les politiques commerciales.
2MGO727
International TradeCommerce internationalM.Sc. in Organisation Management, graduate, 3 creditsMaîtrise en gestion des organisations, deuxième cycle, 3 créditsTaught in fall 2024 and winter 2025.Donné à l’automne 2024 et à l’hiver 2025.
Strategy and tools for firms entering international markets, covering export diagnostics, entry mode and country selection, market research, product, pricing, communication and distribution strategy, and transport, payment and legal logistics.
Les stratégies et les outils permettant aux entreprises de s’implanter sur les marchés internationaux, du diagnostic export au choix du mode d’entrée et du pays, en passant par l’étude de marché, les stratégies de produit, de prix, de communication et de distribution, ainsi que les logistiques de transport, de paiement et juridique.
Université Soumaré, fall 2024Université Soumaré, automne 2024
ECO507
Advanced Applied MacroeconomicsMacroéconomie appliquée avancéeDepartment of Economics, graduateDépartement d’économie, deuxième cycle
Real business cycle and New Keynesian DSGE models, from theory to computation, with quantitative solution in Matlab and Dynare at the centre of the course.
Les modèles DSGE de cycles réels et néo-keynésiens, de la théorie au calcul, avec la résolution quantitative sous Matlab et Dynare au cœur du cours.
Université Laval, summer sessions 2022 to 2024Université Laval, sessions d’été 2022 à 2024
ECN-1010
Principles of MacroeconomicsPrincipes de macroéconomieDepartment of Economics, undergraduate, 3 credits, summer 2022 to summer 2024Département d’économique, premier cycle, 3 crédits, été 2022 à été 2024
Full employment, price stability and the balance of payments, national accounting, money and financial institutions, the role of the State in aggregate demand, and macroeconomic policy under an open-economy constraint.
Le plein emploi, la stabilité des prix et la balance des paiements, la comptabilité nationale, la monnaie et les institutions financières, le rôle de l’État dans la demande globale, et la politique macroéconomique sous la contrainte d’une économie ouverte.
ECN-1000
Principles of MicroeconomicsPrincipes de microéconomieDepartment of Economics, undergraduate, 3 creditsDépartement d’économique, premier cycle, 3 crédits
Scarcity, choice and opportunity cost, supply and demand, elasticity and government intervention, consumer preferences and budget constraints, firm production and cost functions, and pricing in competitive and monopolistic markets.
La rareté, le choix et le coût d’option, l’offre et la demande, l’élasticité et l’intervention gouvernementale, les préférences et les contraintes budgétaires des consommateurs, la production et les fonctions de coûts des entreprises, et la formation des prix sur les marchés concurrentiels et monopolistiques.
Macroeconomic dataDonnées macroéconomiques
Macroeconomic data for the DR CongoDonnées macroéconomiques de la RD Congo
Part of my work takes the Congolese economy as its object, so this page keeps a short public record of the aggregates that discipline it. The country is the case that motivates much of the resource-dependence literature: mineral exports carry the external accounts, the extractive sector carries growth, and the room monetary and fiscal policy has to act moves with the copper and cobalt cycle. The figures below are the published ones, dated and attributed, not my own estimates.
Une partie de mes travaux prend l’économie congolaise pour objet ; cette page en tient donc un relevé public et bref. Le pays est le cas qui motive une bonne part de la littérature sur la dépendance aux ressources : les exportations minières portent les comptes extérieurs, le secteur extractif porte la croissance, et la marge de manœuvre des politiques monétaire et budgétaire suit le cycle du cuivre et du cobalt. Les chiffres ci-dessous sont ceux qui ont été publiés, datés et attribués ; ce ne sont pas mes estimations.
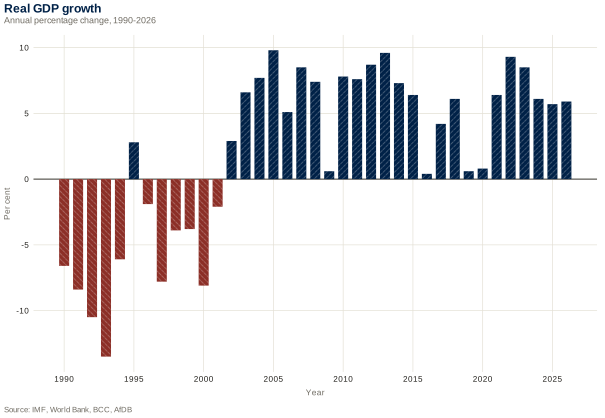
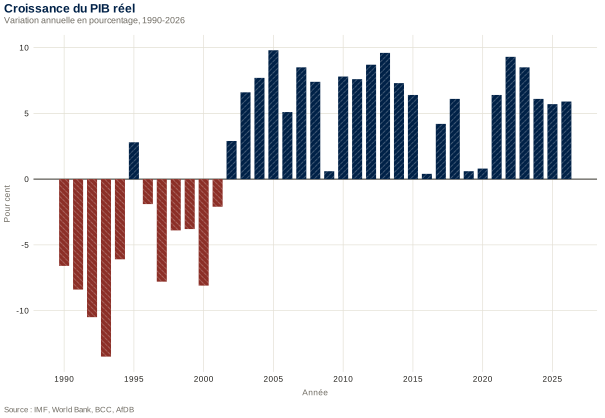
Real GDP growth, 1990–2026, per centCroissance du PIB réel, 1990–2026, en pourcentage
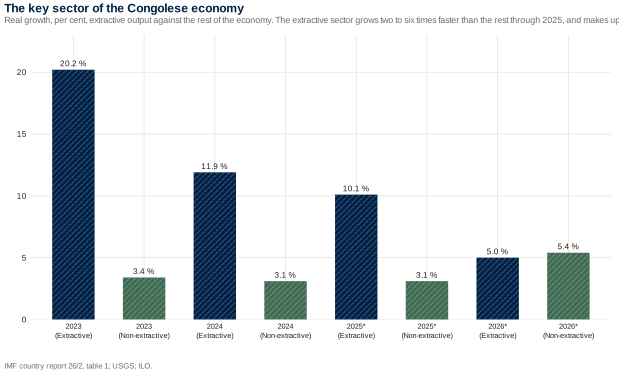
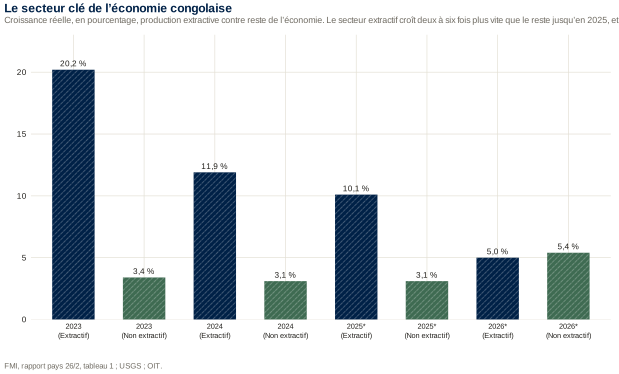
Twenty-five years without a lost decade, and the record deserves to be read with two corrections. The mean of 5.4 per cent a year hides a population growing above three per cent, so output per head gains barely two points a year. And the growth is carried by the extractive sector, which grows three to four times faster than the rest and employs about one worker in twelve. A high growth rate is a necessary condition for development, not a sufficient one; the shape of that growth decides the rest.Vingt-cinq années sans décennie perdue, et ce résultat mérite deux corrections. La moyenne de 5,4 pour cent l’an masque une population qui croît de plus de trois pour cent : le produit par habitant ne gagne donc guère plus de deux points par an. Et cette croissance est portée par le secteur extractif, qui croît trois à quatre fois plus vite que le reste et occupe environ un travailleur sur douze. Un taux de croissance élevé est une condition nécessaire du développement, non une condition suffisante : c’est la forme de la croissance qui décide du reste.
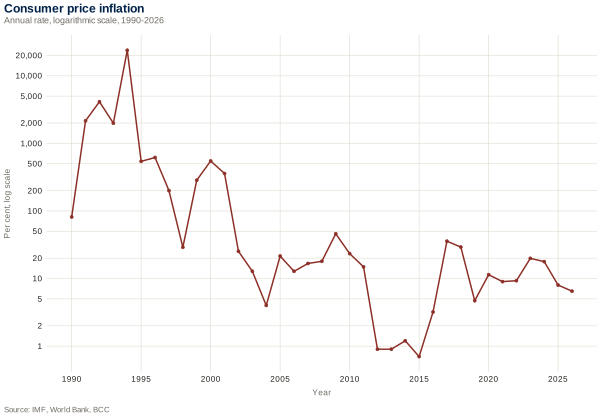
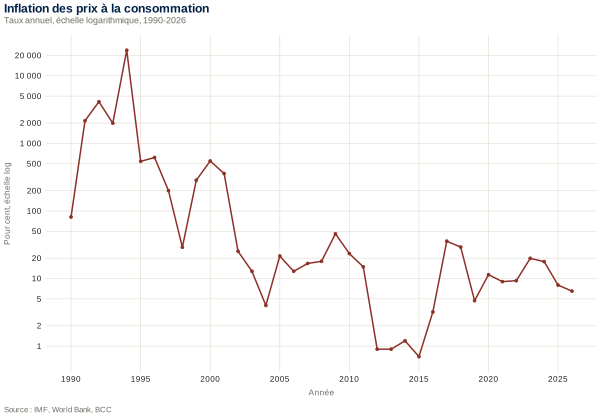
Consumer price inflation, 1990–2026, logarithmic scaleInflation des prix à la consommation, 1990–2026, échelle logarithmique
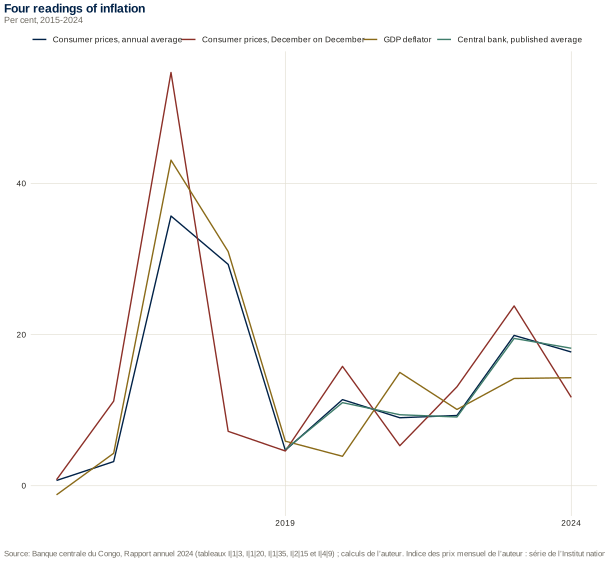
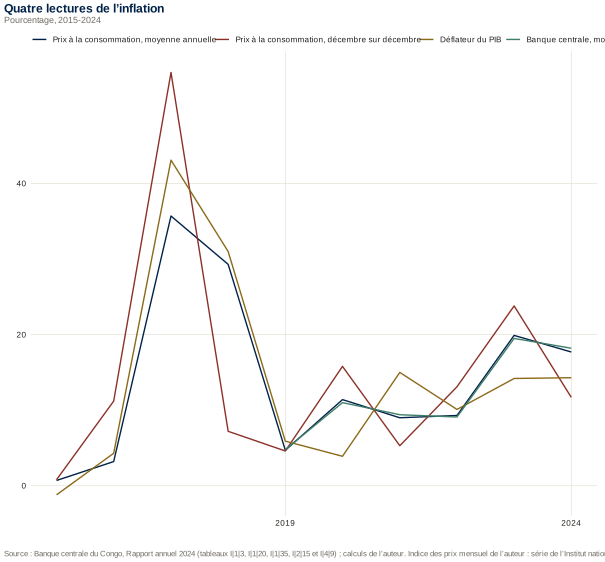
A logarithmic scale is not a stylistic choice here, it is the only way to hold hyperinflation and single-digit inflation in one frame. Three regimes are visible: the monetary collapse of the 1990s, the stabilisation after 2002, and the episode of 2023 and 2024, when the currency depreciated sharply. The last part of the curve is the useful one for policy: inflation returns to single digits when the exchange rate steadies, which says that the nominal anchor of this economy is the dollar rate and not the policy rate.L’échelle logarithmique n’est pas ici un choix de style, c’est le seul moyen de tenir dans un même cadre l’hyperinflation et une inflation à un chiffre. Trois régimes se voient : l’effondrement monétaire des années 1990, la stabilisation après 2002, et l’épisode de 2023 et 2024, quand la monnaie s’est fortement dépréciée. La dernière partie de la courbe est celle qui sert à la politique économique : l’inflation revient à un chiffre lorsque le change se tient, ce qui dit que l’ancrage nominal de cette économie est le taux de change et non le taux directeur.
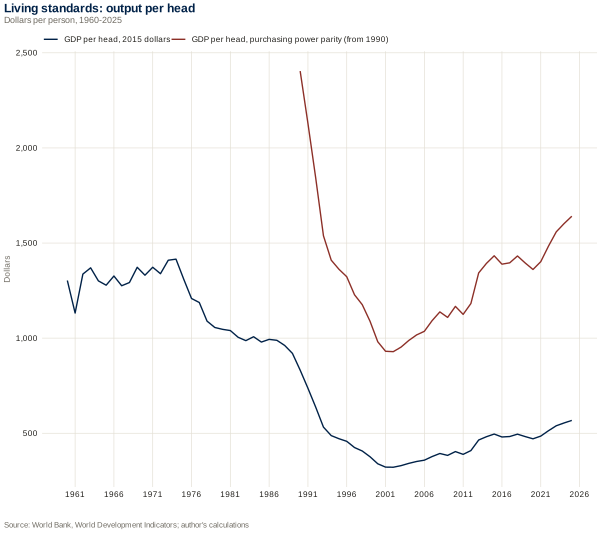
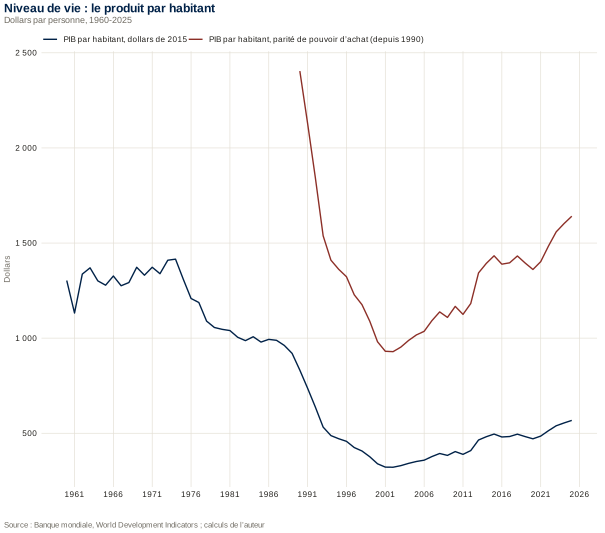
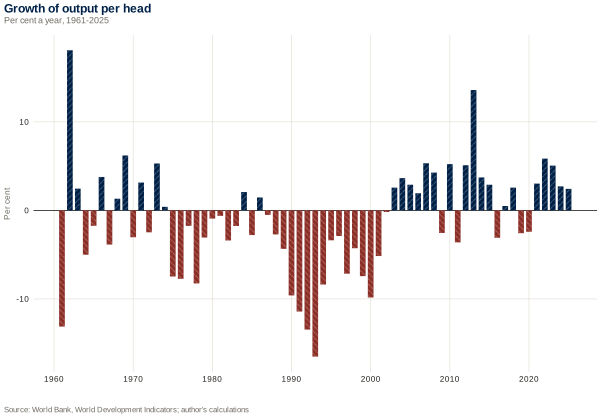
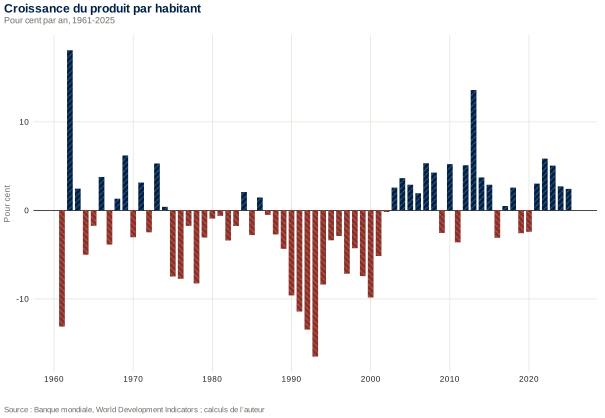
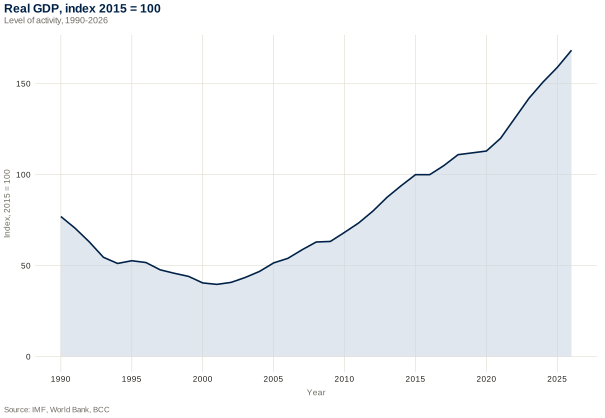
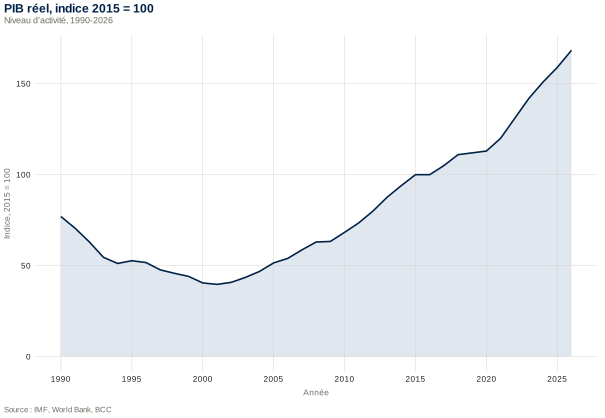
This is the plate to show a class that has just been taught growth rates. Output regained its 1990 level only in the second half of the 2000s, and output per head has still not regained it: at about 570 dollars of 2015 against 830 in 1990, a Congolese is a third poorer than a Congolese of thirty-five years ago. Two decades of five per cent growth have repaired a collapse; they have not yet produced development.Voilà la planche à montrer à une classe qui vient d’apprendre les taux de croissance. La production n’a retrouvé son niveau de 1990 que dans la seconde moitié des années 2000, et le produit par habitant ne l’a toujours pas retrouvé : à environ 570 dollars de 2015 contre 830 en 1990, un Congolais est plus pauvre d’un tiers qu’un Congolais d’il y a trente-cinq ans. Vingt ans de croissance à cinq pour cent ont réparé un effondrement ; ils n’ont pas encore produit du développement.
How to find a series, and how to download itComment trouver une série, et comment la télécharger
Everything below this line is arranged in fourteen tabs. Each tab holds the tables that belong together, the figures drawn from them, and the note that says where the numbers come from. Nothing here is my own estimate: every cell is a published, dated and attributed figure, and where a series has never been published the cell carries a dash and the note says so.
Tout ce qui suit est rangé en quatorze onglets. Chaque onglet porte les tableaux qui vont ensemble, les figures qui en sont tirées et la note qui dit d’où viennent les chiffres. Rien ici n’est une estimation de ma main : chaque case est un chiffre publié, daté et attribué, et là où une série n’a jamais été publiée la case porte un tiret et la note le dit.
Where each thing isOù se trouve quoi
Current readingsConjoncturethe weekly and monthly readings of the central bank: inflation, the exchange rate, the policy rate, reserves.les relevés hebdomadaires et mensuels de la banque centrale : inflation, taux de change, taux directeur, réserves.
National and external accountsComptes nationaux et extérieursgross domestic product by expenditure, the balance of payments, external debt, the reserve position.le produit intérieur brut par la dépense, la balance des paiements, la dette extérieure, la position de réserves.
Public finances and moneyFinances publiques et monnaierevenue and expenditure, the fiscal balance, the monetary aggregates.recettes et dépenses, solde budgétaire, agrégats monétaires.
Prices and commoditiesPrix et matières premièresthe price index, copper and cobalt, the long inflation record.l’indice des prix, le cuivre et le cobalt, l’inflation longue.
Sectors, the key sector and infrastructureSecteurs, secteur clé et infrastructureswhere output comes from, where work is, and what the country is equipped with.d’où vient la production, où est le travail, de quoi le pays est équipé.
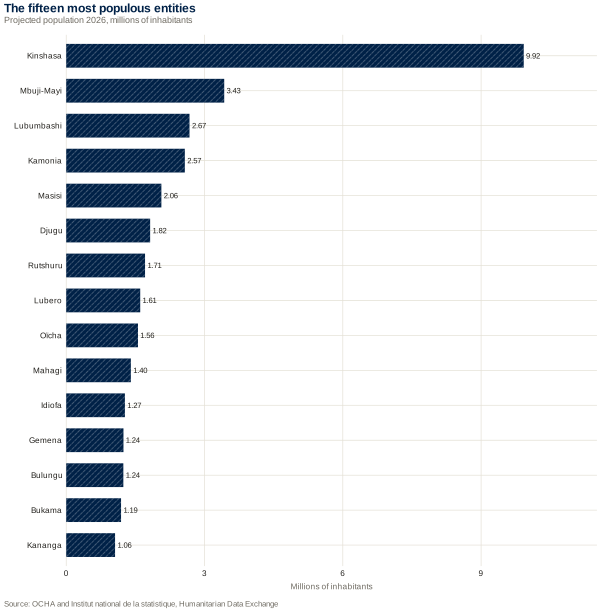
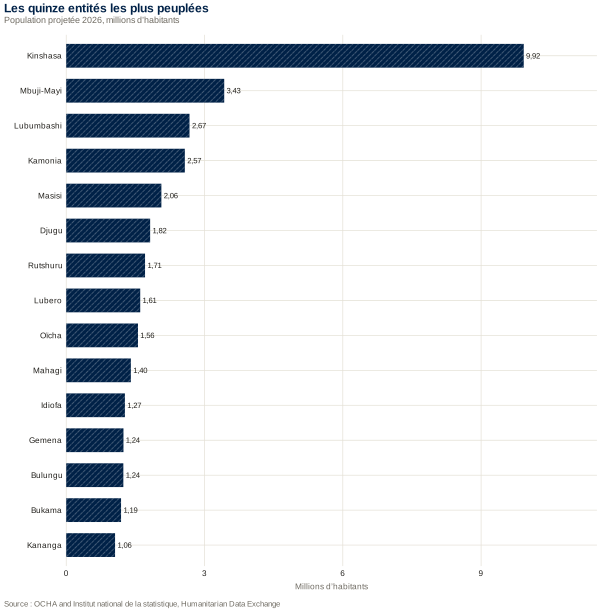
PopulationPopulationthe territorial projections, the age structure, the fifteen largest cities.les projections par territoire, la structure par âge, les quinze premières villes.
Migration and remittancesMigrations et envois de fondsthe diaspora, asylum, immigration, internal displacement, and the money sent home.la diaspora, l’asile, l’immigration, les déplacements internes et l’argent envoyé au pays.
Poverty, development and governancePauvreté, développement et gouvernancethe poverty headcount, human development, and the governance indices.le taux de pauvreté, le développement humain et les indices de gouvernance.
Work and productivityEmploi et productivitéwho is without work, what kind of work the rest do, and what an hour of it produces.qui est sans emploi, quel travail font les autres, et ce que produit une heure de ce travail.
The economic situationSituation économiquea single quantitative report on the country, assembling the other panes into one continuous argument.un rapport quantitatif unique sur le pays, qui rassemble les autres volets en un raisonnement continu.
Security and demographySécurité et démographiedisplacement and its provinces, refuge abroad, violations of international humanitarian law, mortality and fertility.déplacements et provinces d’accueil, refuge à l’étranger, violations du droit international humanitaire, mortalité et fécondité.
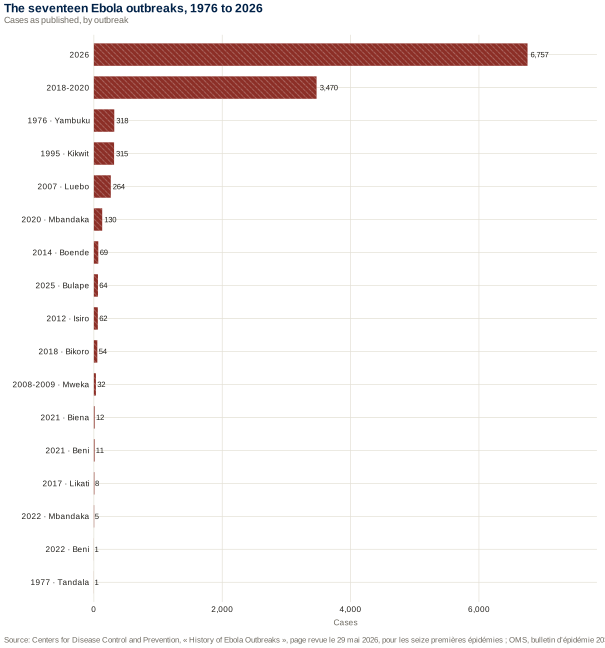
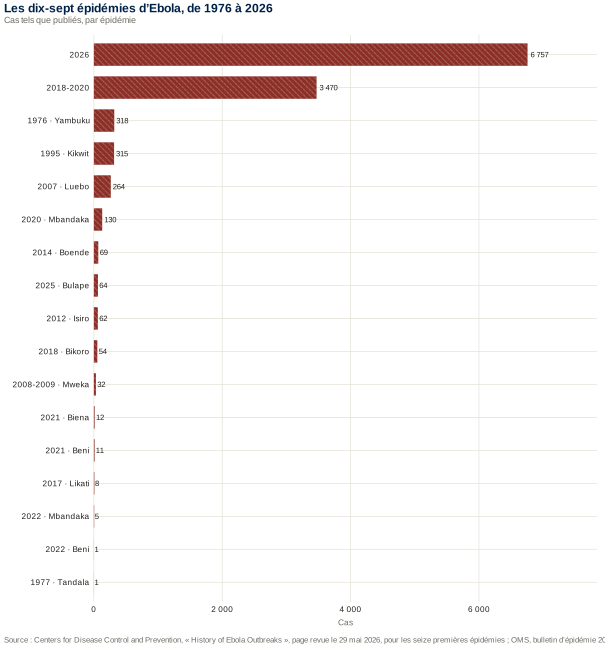
Health and epidemicsSanté et épidémiesthe seventeenth Ebola outbreak reading by reading, its six provinces and the health zones of Ituri, the seventeen outbreaks since 1976, and mpox, cholera and polio under surveillance. This pane alone watches its own source: when the World Health Organization publishes a bulletin later than the one its tables cite, a line at the top of the pane says so and links to it.la dix-septième épidémie d’Ebola relevé par relevé, ses six provinces et les zones de santé de l’Ituri, les dix-sept épidémies depuis 1976, et la mpox, le choléra et la poliomyélite sous surveillance. Ce volet est le seul à surveiller sa propre source : lorsque l’Organisation mondiale de la santé publie un bulletin postérieur à celui que ses tableaux citent, une ligne en tête du volet le dit et y renvoie.
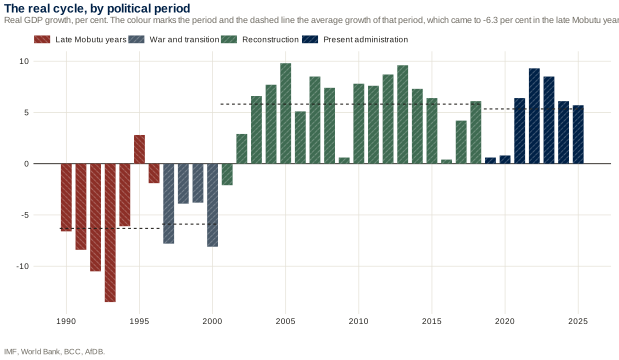
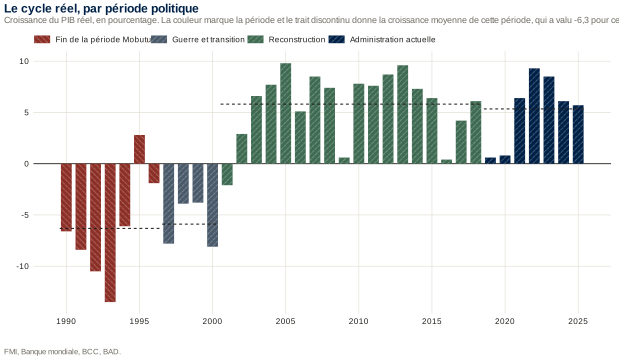
Political regimes and announced measuresRégimes politiques et mesures annoncéesthe real cycle period by period, and what each government announced.le cycle réel période par période, et ce que chaque gouvernement a annoncé.
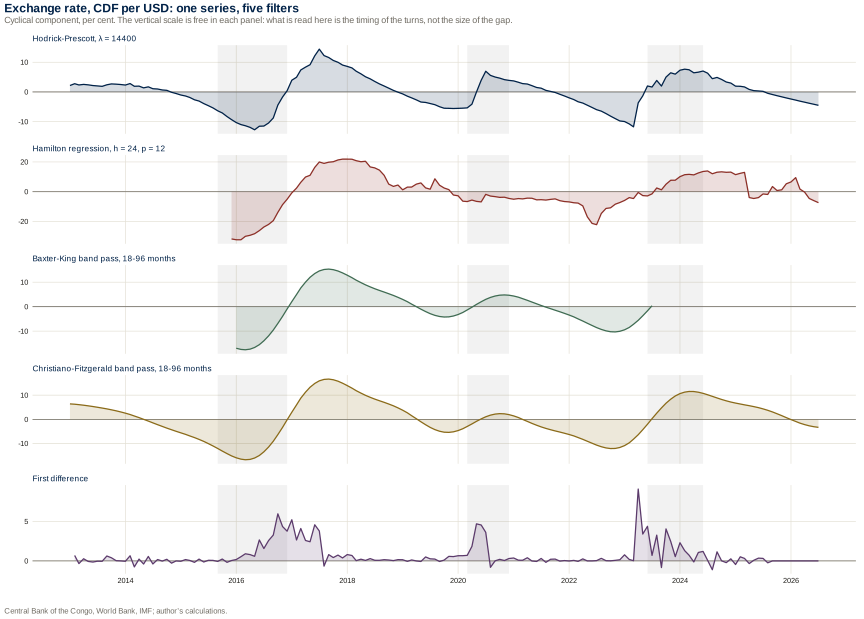
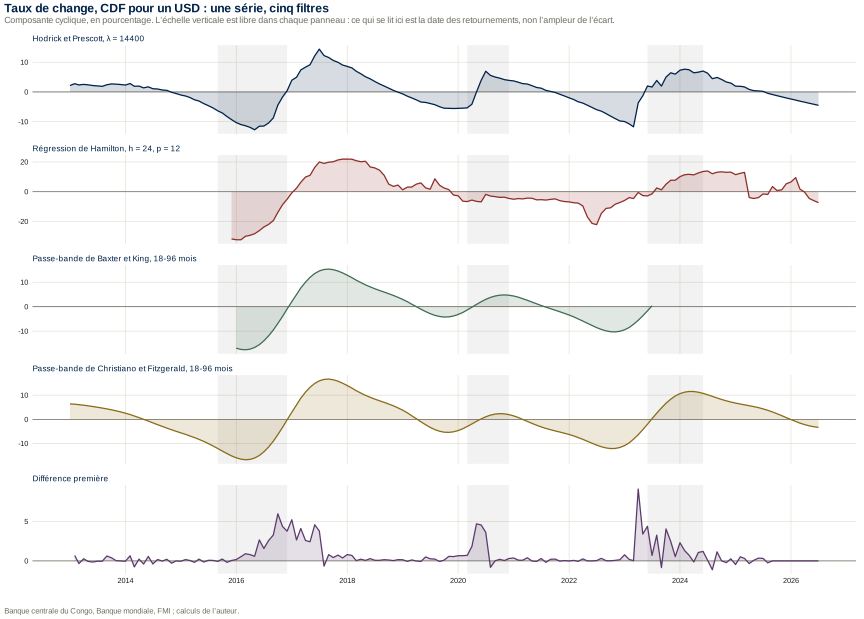
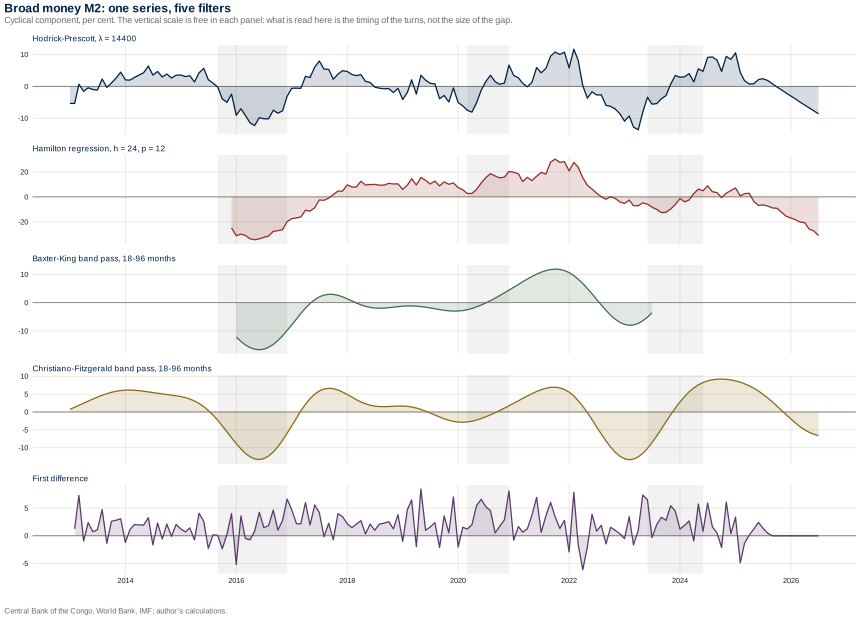
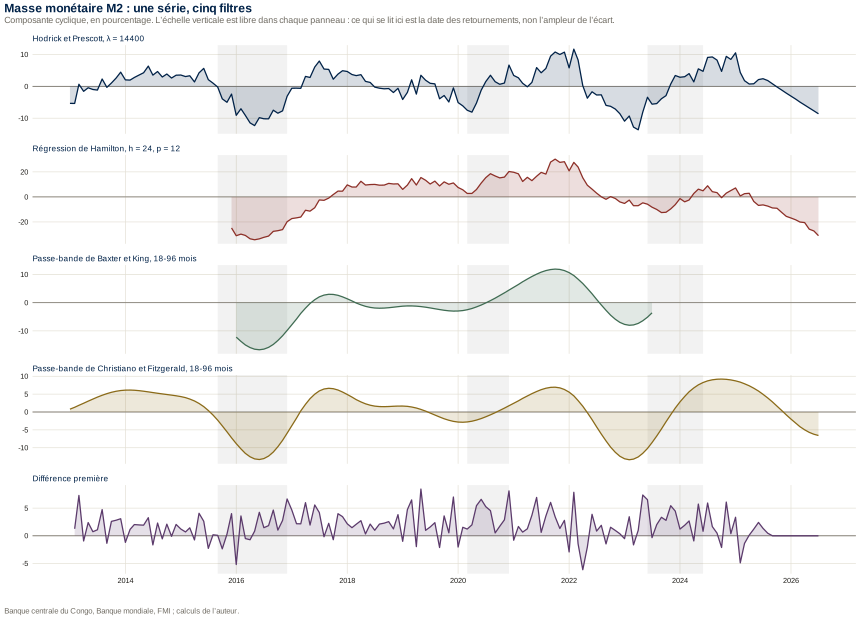
Stylised factsFaits stylisésthe filtered series, the moments of the cycle, the comparison of filters, and the structural features.les séries filtrées, les moments du cycle, la comparaison des filtres et les traits de structure.
Downloading a tableTélécharger un tableau
Under every table there is a row of small buttons. CSV gives the plain comma-separated file, which opens in any spreadsheet and reads into R, Stata or Python without further work. XLSX gives the same content as a Excel workbook, with the column headings already in place. TEX gives a booktabs table ready to be included in a LaTeX document. The three buttons serve the table as it stands on screen, in the language the page is currently showing, so switch the language first if you want the English or the French headings.
Sous chaque tableau se trouve une rangée de petits boutons. CSV donne le fichier séparé par des virgules, qui s’ouvre dans n’importe quel tableur et se lit dans R, Stata ou Python sans autre manipulation. XLSX donne le même contenu sous forme de classeur Excel, en-têtes de colonnes en place. TEX donne un tableau booktabs prêt à être inséré dans un document LaTeX. Les trois boutons servent le tableau tel qu’il est à l’écran, dans la langue affichée : changez donc la langue d’abord si vous voulez les en-têtes anglais ou français.
Downloading a figureTélécharger une figure
Every plate carries, just under the image, its size in inches and millimetres and two links marked SVG EN and SVG FR. The file is vector, not a photograph of a chart: it can be enlarged without loss, dropped straight into a LaTeX or Word document, and reopened in Inkscape or Illustrator if you need to change a label. The English and the French plate are separate files, so a bilingual paper can carry both.
Chaque planche porte, juste sous l’image, sa taille en pouces et en millimètres et deux liens marqués SVG EN et SVG FR. Le fichier est vectoriel, non la photographie d’un graphique : il s’agrandit sans perte, s’insère tel quel dans un document LaTeX ou Word, et se rouvre dans Inkscape ou Illustrator si vous devez modifier une étiquette. La planche anglaise et la planche française sont deux fichiers distincts, de sorte qu’un article bilingue puisse porter les deux.
Taking everything at onceTout prendre d’un coup
The whole registry of series sits in one file, data/series.json, and the same content is mirrored one series per file under data/csv/. The plates live under figures/, two files per plate. The scripts that build all of it are under tools/: sf_prepare.py assembles the monthly base and applies the filters, sf_svg.py draws the plates, sf_tables.py computes the moments. Nothing beyond the Python standard library is needed to run them.
Le registre complet des séries tient dans un seul fichier, data/series.json, et le même contenu est reproduit à raison d’une série par fichier sous data/csv/. Les planches sont sous figures/, deux fichiers par planche. Les scripts qui fabriquent l’ensemble sont sous tools/ : sf_prepare.py assemble le socle mensuel et applique les filtres, sf_svg.py trace les planches, sf_tables.py calcule les moments. Rien d’autre que la bibliothèque standard de Python n’est nécessaire pour les exécuter.
One caution on searching. The fourteen panels are all present in the page, but only the open one is displayed, and a browser’s find command will not reach into a panel that is closed. Open the tab first, then search inside it.
Une mise en garde sur la recherche. Les quatorze volets sont tous présents dans la page, mais seul le volet ouvert est affiché, et la commande de recherche du navigateur n’atteint pas un volet fermé. Ouvrez l’onglet d’abord, puis cherchez à l’intérieur.
Central Bank of the Congo, current readingsBanque Centrale du Congo, relevés courants
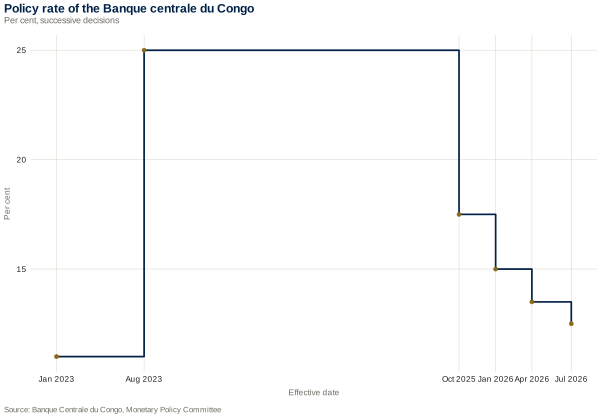
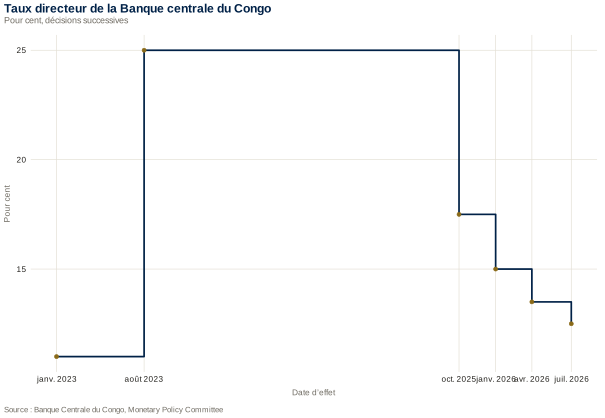
BCC policy rate, January 2023 – July 2026, per centTaux directeur de la BCC, janvier 2023 – juillet 2026, en pourcentage
A policy rate raised from 11 to 25 per cent in August 2023 and brought back by steps is a textbook tightening cycle, with one Congolese peculiarity: more than nine tenths of deposits are in foreign currency, so the interest rate channel reaches a small part of the money stock. The rate works here mainly as a signal and through the exchange rate. Judge the cycle by the currency and by reserves rather than by credit growth.Un taux directeur porté de 11 à 25 pour cent en août 2023 puis ramené par paliers, c’est un cycle de resserrement de manuel, avec une particularité congolaise : plus de neuf dixièmes des dépôts sont en devises, de sorte que le canal du taux d’intérêt n’atteint qu’une petite part des encaisses. Le taux agit ici surtout comme un signal et par le change. Ce cycle se juge donc à la tenue de la monnaie et aux réserves plutôt qu’à la croissance du crédit.
International reserves, 2026, billions of US dollarsRéserves internationales, 2026, en milliards de dollars
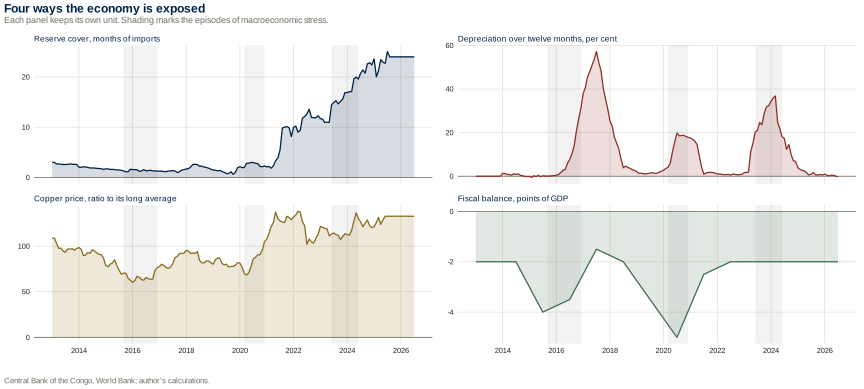
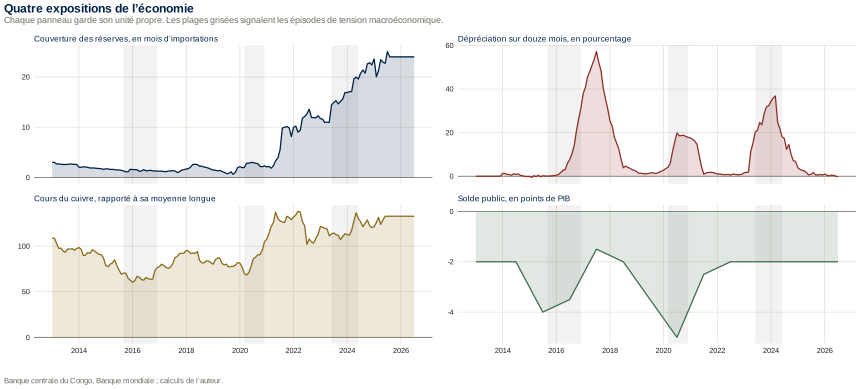
Reserves are the shock absorber of this economy, and it is thin. The Fund counts ten weeks of imports for 2024, against the three months usually taken as prudent, so a fall in the copper price is passed to the exchange rate and then to household purchasing power rather than being smoothed. Watch the level against that threshold rather than the week-to-week movement, which follows the calendar of mining receipts and external disbursements.Les réserves sont l’amortisseur de cette économie, et il est mince. Le Fonds monétaire compte dix semaines d’importations pour 2024, contre les trois mois tenus d’ordinaire pour prudents : une baisse du cuivre se transmet donc au taux de change, puis au pouvoir d’achat des ménages, au lieu d’être lissée. Ce niveau se lit contre ce seuil plutôt que dans son mouvement d’une semaine à l’autre, qui suit le calendrier des recettes minières et des décaissements extérieurs.
Annual aggregates, per centAgrégats annuels, en pourcentage
IndicatorIndicateur
2024
2025
2026p
SourceSource
Real GDP growthCroissance du PIB réel
6.16,1
5.55,5
5.75,7
BAD, BCC
GDP per capita growthCroissance du PIB par habitant
2.72,7
2.12,1
—
BAD
Extractive sector growthCroissance du secteur extractif
11.911,9
8.28,2
—
BAD
InflationInflation
17.717,7
8.08,0
6.56,5
BAD
Current account, % GDPSolde courant, % du PIB
−4.1−4,1
−3.3−3,3
−2.9−2,9
BAD
Fiscal balance, % GDPSolde budgétaire, % du PIB
−2.1−2,1
−2.6−2,6
—
BAD
Public debt, % GDPDette publique, % du PIB
20.920,9
18.118,1
—
BAD
Tax revenue, % GDPPression fiscale, % du PIB
—
13.513,5
—
BAD
Non-performing loans, %Créances en souffrance, %
6.06,0
5.25,2
—
BAD
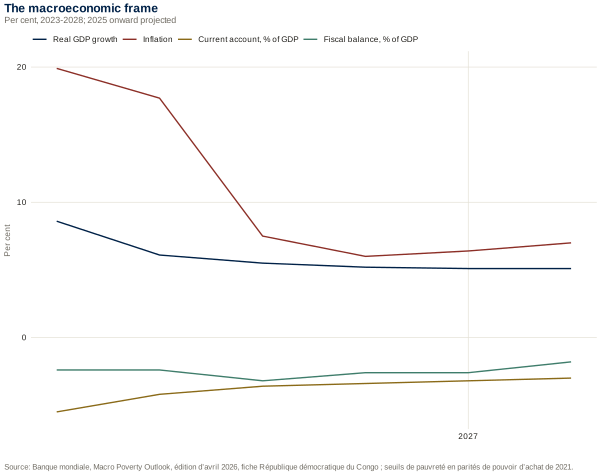
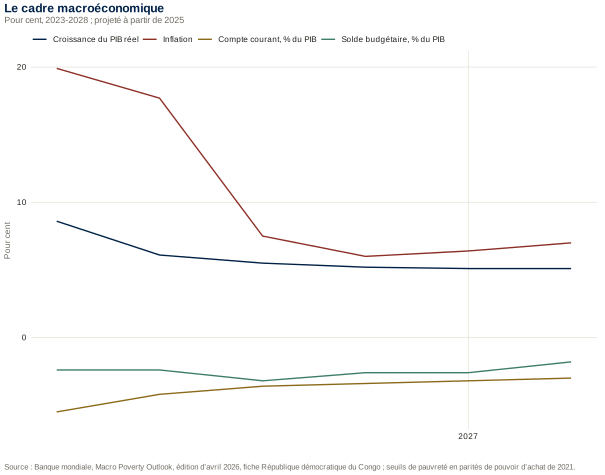
Superscript p marks a projection. The World Bank puts 2025 growth at the same 5.5 per cent and 2025 inflation slightly lower, at 7.5 per cent. The 2026 current-account balance differs by source: the African Development Bank reports −2.9 per cent of GDP, the IMF −2.2 and the World Bank −3.4. Vintages and assumptions differ, so each figure is given as published and none is reconciled.L’exposant p signale une projection. La Banque mondiale retient la même croissance de 5,5 pour cent en 2025 et une inflation légèrement plus basse, 7,5 pour cent. Le solde courant 2026 varie selon la source : la Banque africaine de développement indique −2,9 pour cent du PIB, le FMI −2,2 et la Banque mondiale −3,4. Les millésimes et les hypothèses diffèrent ; chaque chiffre est donné tel que publié et aucun n’est concilié.
Monetary stance, latest readingPosition monétaire, dernier point
Policy rateTaux directeur
12.5 %12,5 %17 July 202617 juillet 2026
Marginal lending facilityFacilité de prêt marginal
16.5 %16,5 %17 July 202617 juillet 2026
Reserve requirementRéserve obligatoire
12 %12 %20252025
Cumulative inflationInflation cumulée
6.03 %6,03 %since 1 January, at 8 August 2026depuis le 1er janvier, au 8 août 2026
Inflation, year on yearInflation en glissement annuel
3.22 %3,22 %8 August 20268 août 2026
Annualised inflationInflation annualisée
10.19 %10,19 %BCC estimate, 8 August 2026estimation BCC, 8 août 2026
Exchange rateTaux de change
2,261.82 CDF/USD2 261,82 CDF/USDindicative rate, 12 August 2026taux indicatif, 12 août 2026
International reservesRéserves internationales
7.92 bn USD7,92 Md USDclose to three months of imports, end-July 2026près de trois mois d’importations, fin juillet 2026
Deposits held in foreign currencyDépôts en devises
88.3 %88,3 %of total deposits, end-June 2026de l’encours total, fin juin 2026
Extreme povertyPauvreté extrême
67 %67 %of the population, 2025de la population, 2025
The accounts of an open, mineral-dependent economyLes comptes d’une économie ouverte et minière
What follows sets out the Congolese accounts in the order an open-economy macroeconomist reads them: the level of activity first, then the external constraint that acts on it. The two are tied together by a single mechanism. Mineral exports carry the trade balance; a structural deficit on services, freight above all, takes back a good part of what the mines bring in; and what remains, once foreign direct investment and debt service have passed through, is the room the country actually has. The tables give the published figures for each of those steps and state plainly where a published figure does not exist.
Ce qui suit dispose les comptes congolais dans l’ordre où les lit un macroéconomiste de l’économie ouverte : le niveau d’activité d’abord, puis la contrainte extérieure qui s’exerce sur lui. Un seul mécanisme les relie. Les exportations minières portent la balance commerciale ; un déficit structurel sur les services, le fret au premier chef, reprend une bonne part de ce que les mines rapportent ; et ce qui subsiste, une fois passés l’investissement direct étranger et le service de la dette, constitue la marge dont le pays dispose réellement. Les tableaux donnent les chiffres publiés pour chacune de ces étapes et disent clairement là où aucun chiffre publié n’existe.
Gross domestic product, levels and usesProduit intérieur brut, niveaux et emplois
Figure by James Wabenga Yango. Source: FMI, République démocratique du Congo : deuxième revue des accords FEC et FRD, rapport pays nº 26/2, janvier 2026. Banque mondiale, Macro Poverty Outlook, édition d’avril 2026, fiche République démocratique du Congo ; seuils de pauvreté en parités de pouvoir d’achat de 2021.Figure de James Wabenga Yango. Source : FMI, République démocratique du Congo : deuxième revue des accords FEC et FRD, rapport pays nº 26/2, janvier 2026. Banque mondiale, Macro Poverty Outlook, édition d’avril 2026, fiche République démocratique du Congo ; seuils de pauvreté en parités de pouvoir d’achat de 2021.How to citeComment citer
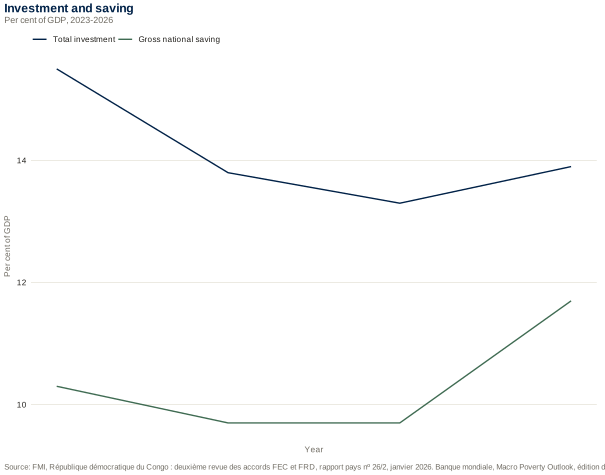
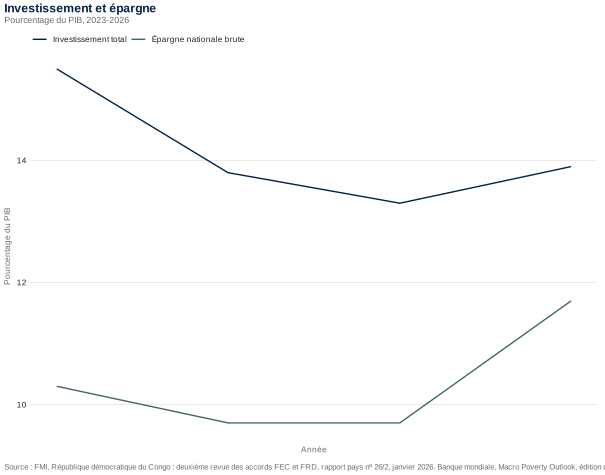
Total investment, % of GDPInvestissement total, % du PIB
Gross national saving, % of GDPÉpargne nationale brute, % du PIB
2023
170,711170 711
69.869,8
—
—
15.515,5
10.310,3
2024
216,585216 585
76.776,7
77.777,7
710.9710,9
13.813,8
9.79,7
2025
246,893246 893
91.891,8
87.687,6
776.7776,7
13.313,3
9.79,7
2026
269,331269 331
109.2109,2
—
—
13.913,9
11.711,7
2025 and 2026 are Fund projections, not outturns. The Fund and the Bank do not use the same nominal denominator: the gap reaches four billion dollars in 2025, so every ratio on this page names the denominator it rests on. The Fund publishes total investment and national saving but not gross fixed capital formation or household consumption separately, which is why those two lines are absent.2025 et 2026 sont des projections du Fonds, non des réalisations. Le Fonds et la Banque ne retiennent pas le même dénominateur nominal : l’écart atteint quatre milliards de dollars en 2025, de sorte que chaque ratio de cette page nomme le dénominateur sur lequel il repose. Le Fonds publie l’investissement total et l’épargne nationale, mais ni la formation brute de capital fixe ni la consommation des ménages prises séparément : ces deux lignes manquent donc.
Source:Source : FMI, République démocratique du Congo : deuxième revue des accords FEC et FRD, rapport pays nº 26/2, janvier 2026. Banque mondiale, Macro Poverty Outlook, édition d’avril 2026, fiche République démocratique du Congo ; seuils de pauvreté en parités de pouvoir d’achat de 2021.
Table compiled by James Wabenga Yango.Tableau composé par James Wabenga Yango.How to citeComment citer
Balance of payments, main balancesBalance des paiements, principaux soldes
Figure by James Wabenga Yango. Source: FMI, République démocratique du Congo : deuxième revue des accords FEC et FRD, rapport pays nº 26/2, janvier 2026. Banque mondiale, Macro Poverty Outlook, édition d’avril 2026, fiche République démocratique du Congo ; seuils de pauvreté en parités de pouvoir d’achat de 2021.Figure de James Wabenga Yango. Source : FMI, République démocratique du Congo : deuxième revue des accords FEC et FRD, rapport pays nº 26/2, janvier 2026. Banque mondiale, Macro Poverty Outlook, édition d’avril 2026, fiche République démocratique du Congo ; seuils de pauvreté en parités de pouvoir d’achat de 2021.How to citeComment citer
Services balance, $mSolde des services, millions USD
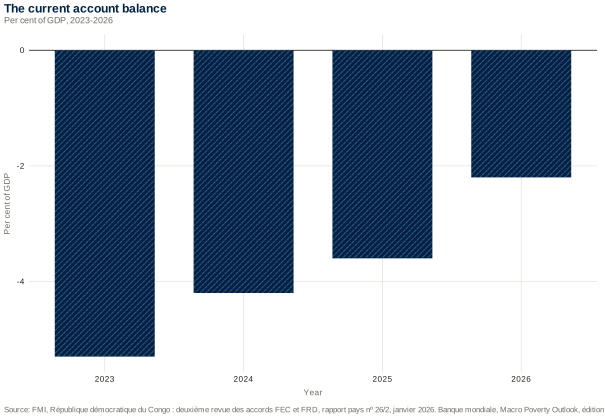
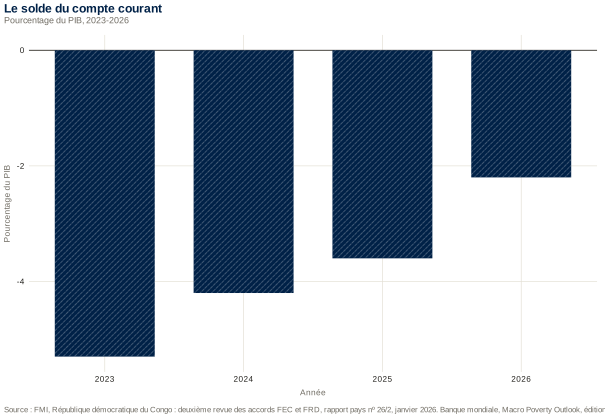
Current account, % of GDP (World Bank)Solde courant, % du PIB (Banque mondiale)
2023
-5.3-5,3
-3,678-3 678
1,6011 601
-5,094-5 094
-5.5-5,5
2024
-4.2-4,2
-3,187-3 187
4,2314 231
-5,821-5 821
-4.2-4,2
2025
-3.6-3,6
-3,340-3 340
4,5624 562
-5,906-5 906
-3.6-3,6
2026
-2.2-2,2
-2,384-2 384
6,2066 206
-6,486-6 486
-3.4-3,4
The external position of the DRC is the arithmetic of a mining surplus on goods offset by a structural deficit on services, freight and insurance above all, which the landlocked geography of the copper belt makes unavoidable. The two institutions agree on 2024 and 2025 and part company on 2026; both readings are given rather than reconciled.La position extérieure de la RD Congo se ramène à l’arithmétique d’un excédent minier sur les biens compensé par un déficit structurel sur les services, fret et assurance au premier chef, que l’enclavement de la ceinture du cuivre rend inévitable. Les deux institutions s’accordent sur 2024 et 2025 et divergent sur 2026 ; les deux lectures sont données plutôt que réconciliées.
Source:Source : FMI, République démocratique du Congo : deuxième revue des accords FEC et FRD, rapport pays nº 26/2, janvier 2026. Banque mondiale, Macro Poverty Outlook, édition d’avril 2026, fiche République démocratique du Congo ; seuils de pauvreté en parités de pouvoir d’achat de 2021.
Table compiled by James Wabenga Yango.Tableau composé par James Wabenga Yango.How to citeComment citer
Goods trade and the weight of the extractive sectorCommerce de biens et poids du secteur extractif
Figure by James Wabenga Yango. Source: FMI, République démocratique du Congo : deuxième revue des accords FEC et FRD, rapport pays nº 26/2, janvier 2026.Figure de James Wabenga Yango. Source : FMI, République démocratique du Congo : deuxième revue des accords FEC et FRD, rapport pays nº 26/2, janvier 2026.How to citeComment citer
of which extractive, $mdont secteur extractif, millions USD
Extractive share, %Part extractive, %
Imports, $mImportations, millions USD
of which capital goods, $mdont biens d’équipement, millions USD
2023
29,60129 601
29,42729 427
99.499,4
28,00028 000
12,08912 089
2024
34,92734 927
34,35734 357
98.498,4
30,69630 696
12,10412 104
2025
36,40636 406
35,71735 717
98.198,1
31,84331 843
13,35613 356
2026
40,15340 153
39,46039 460
98.398,3
33,94733 947
14,48714 487
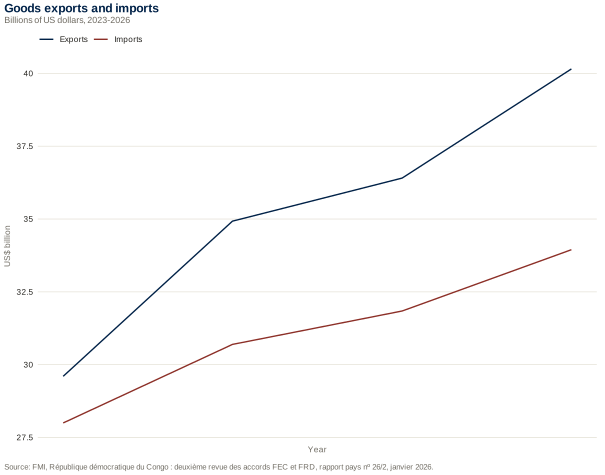
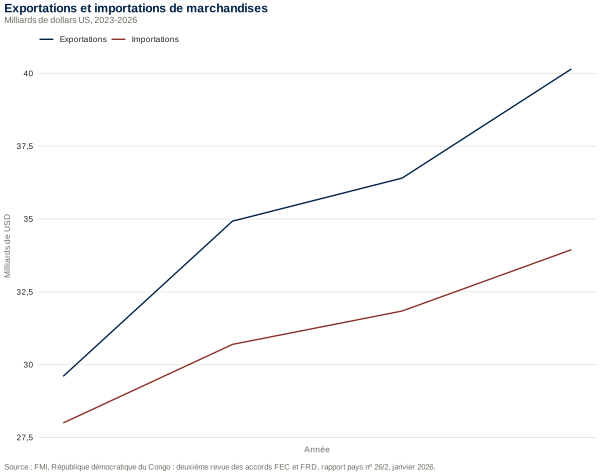
The extractive share never falls below ninety-eight per cent over the period, which is the single fact from which most of the external vulnerability of the country follows. The share is computed from the two published Fund lines. The Fund projects exports to 2028, but not imports, so the table stops where both series stop.La part extractive ne descend jamais sous quatre-vingt-dix-huit pour cent sur la période ; c’est le fait unique d’où découle l’essentiel de la vulnérabilité extérieure du pays. La part est calculée à partir des deux lignes publiées par le Fonds. Le Fonds projette les exportations jusqu’en 2028, mais non les importations : le tableau s’arrête là où les deux séries s’arrêtent.
Source:Source : FMI, République démocratique du Congo : deuxième revue des accords FEC et FRD, rapport pays nº 26/2, janvier 2026.
Table compiled by James Wabenga Yango.Tableau composé par James Wabenga Yango.How to citeComment citer
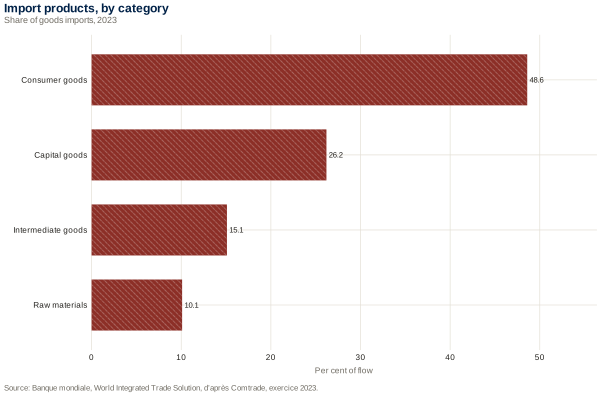
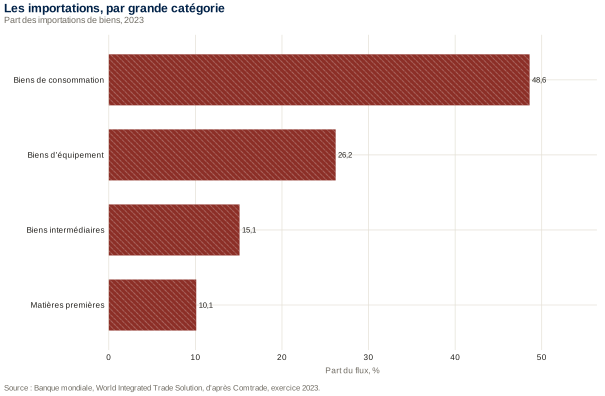
Composition of external trade, 2023Composition du commerce extérieur, 2023
Figure by James Wabenga Yango. Source: Banque mondiale, World Integrated Trade Solution, d’après Comtrade, exercice 2023.Figure de James Wabenga Yango. Source : Banque mondiale, World Integrated Trade Solution, d’après Comtrade, exercice 2023.How to citeComment citer
Figure by James Wabenga Yango. Source: Banque mondiale, World Integrated Trade Solution, d’après Comtrade, exercice 2023.Figure de James Wabenga Yango. Source : Banque mondiale, World Integrated Trade Solution, d’après Comtrade, exercice 2023.How to citeComment citer
Cobalt oxides and hydroxidesOxydes et hydroxydes de cobalt
ExportExportation
4,778.94 778,9
17.2017,20
Copper ores and concentratesMinerais et concentrés de cuivre
ExportExportation
2,158.12 158,1
7.807,80
Unrefined copperCuivre non affiné
ExportExportation
1,410.61 410,6
5.105,10
Non-monetary goldOr non monétaire
ExportExportation
1,323.01 323,0
4.804,80
Consumer goodsBiens de consommation
ImportImportation
12,413.012 413,0
48.6048,60
Capital goodsBiens d’équipement
ImportImportation
6,683.06 683,0
26.2026,20
Intermediate goodsBiens intermédiaires
ImportImportation
3,847.03 847,0
15.1015,10
Raw materialsMatières premières
ImportImportation
2,585.02 585,0
10.1010,10
of which refined petroleum oilsdont huiles de pétrole raffinées
ImportImportation
9,038.79 038,7
35.4035,40
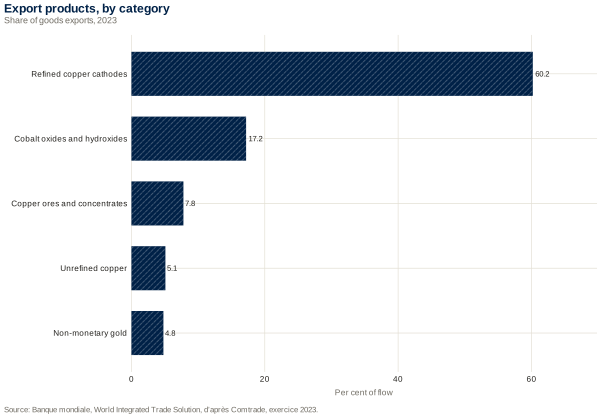
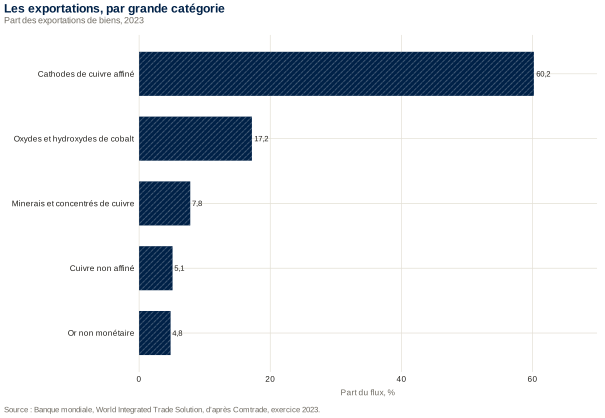
Export shares are taken against declared exports of 27,727 million dollars, import shares against declared imports of 25,529 million dollars, both free on board and cost-insurance-freight respectively as the source records them. Declared customs values fall short of the balance of payments figures in the table above, by about two and a half billion dollars on the export side: the gap is the usual one between mirror statistics and national accounts and should not be read as a measure of smuggling. Refined petroleum is listed separately because it crosses the consumer and intermediate categories in the source.Les parts à l’exportation sont rapportées aux exportations déclarées, 27 727 millions de dollars, et les parts à l’importation aux importations déclarées, 25 529 millions de dollars, respectivement franco à bord et coût-assurance-fret comme la source les enregistre. Les valeurs douanières déclarées restent en deçà des chiffres de balance des paiements du tableau précédent, de quelque deux milliards et demi de dollars à l’exportation : l’écart est celui, habituel, entre statistiques miroirs et comptes nationaux, et ne mesure pas la fraude. Le pétrole raffiné figure à part parce qu’il traverse les catégories consommation et intermédiaire dans la source.
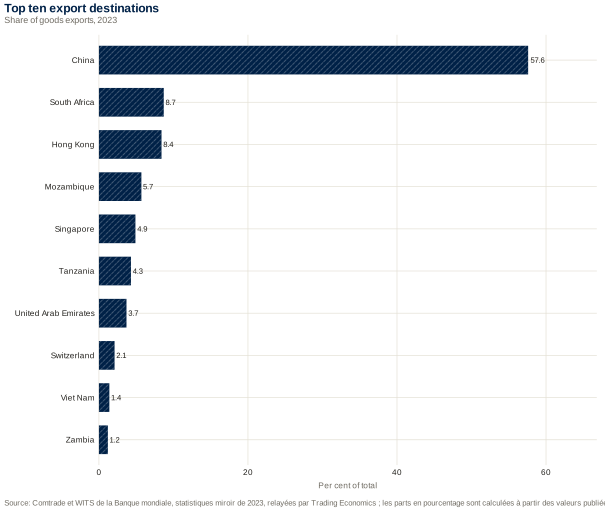
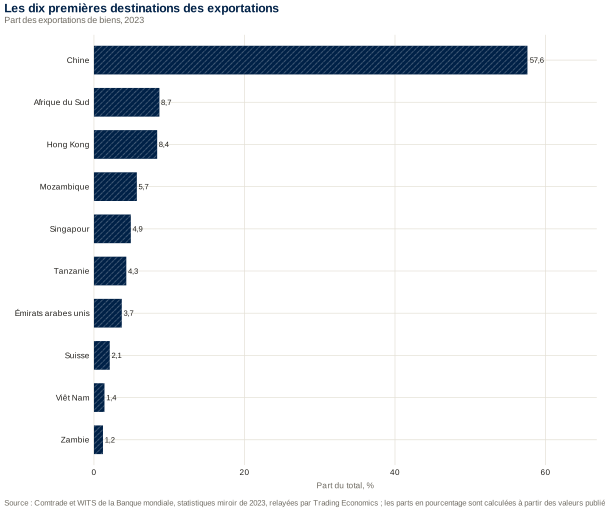
Figure by James Wabenga Yango. Source: Comtrade et WITS de la Banque mondiale, statistiques miroir de 2023, relayées par Trading Economics ; les parts en pourcentage sont calculées à partir des valeurs publiées et du total publié.Figure de James Wabenga Yango. Source : Comtrade et WITS de la Banque mondiale, statistiques miroir de 2023, relayées par Trading Economics ; les parts en pourcentage sont calculées à partir des valeurs publiées et du total publié.How to citeComment citer
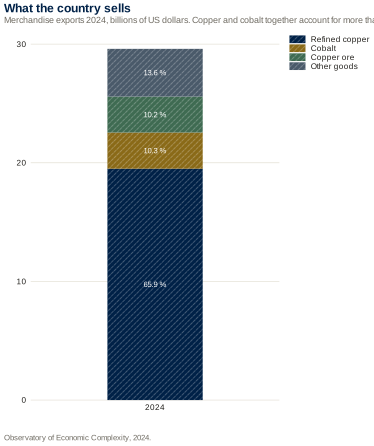
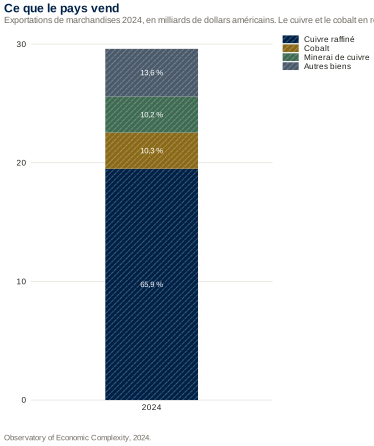
Three readings of this table matter more than the ranking itself. First, one buyer takes more than half of everything the country sells, and the figure is stable: 57.6 per cent to China on the mirror data of 2023, and 57.6 per cent again on the trade-centre data of 2025. A single relationship of that weight is not a trading pattern, it is a dependency. Second, several of the destinations named here are not destinations at all but corridors: South Africa, Mozambique and Tanzania are the ports of Durban, Beira and Dar es Salaam, through which copper leaves for Asia, so the economic concentration is greater than the customs breakdown shows. Third, Asia takes 77 per cent, Africa 21 and Europe 2.5: a country at the centre of the continent trades with the other side of the world. The figures are mirror statistics, that is the declarations of the partners rather than of Congolese customs, which is the more reliable source here; the totals of the other databases differ widely and are not to be mixed with these.Trois lectures de ce tableau comptent davantage que le classement lui-même. La première : un seul acheteur prend plus de la moitié de tout ce que le pays vend, et le chiffre est stable, 57,6 pour cent vers la Chine sur les données miroir de 2023, 57,6 pour cent encore sur les données du centre du commerce international de 2025. Une relation de ce poids n’est pas une orientation commerciale, c’est une dépendance. La deuxième : plusieurs des destinations nommées ici n’en sont pas, ce sont des corridors. L’Afrique du Sud, le Mozambique et la Tanzanie, ce sont les ports de Durban, de Beira et de Dar es Salaam, par où le cuivre part pour l’Asie ; la concentration économique est donc plus forte que ne le montre la ventilation douanière. La troisième : l’Asie prend 77 pour cent, l’Afrique 21 et l’Europe 2,5. Un pays au centre du continent commerce avec l’autre bout du monde. Les chiffres sont des statistiques miroir, c’est-à-dire les déclarations des partenaires et non celles des douanes congolaises, plus fiables ici ; les totaux des autres bases diffèrent fortement et ne se mêlent pas à ceux-ci.
Source:Source : Comtrade et WITS de la Banque mondiale, statistiques miroir de 2023, relayées par Trading Economics ; les parts en pourcentage sont calculées à partir des valeurs publiées et du total publié.
Table compiled by James Wabenga Yango.Tableau composé par James Wabenga Yango.How to citeComment citer
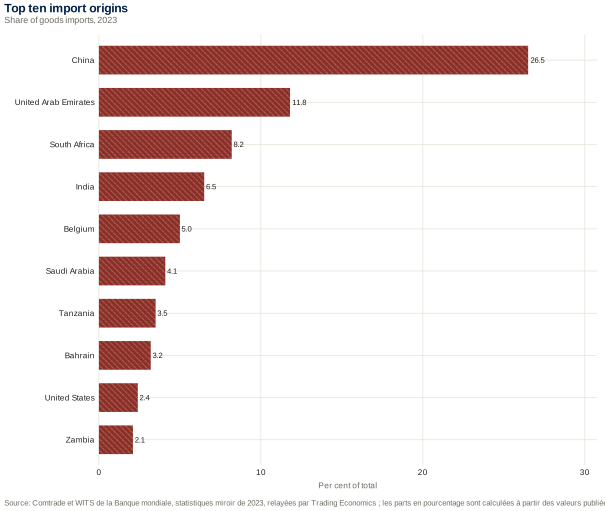
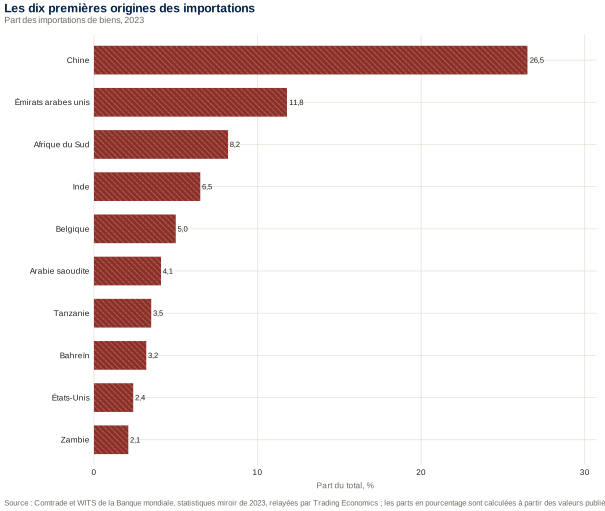
Where Congolese imports come fromD’où viennent les importations congolaises
Figure by James Wabenga Yango. Source: Comtrade et WITS de la Banque mondiale, statistiques miroir de 2023, relayées par Trading Economics ; les parts en pourcentage sont calculées à partir des valeurs publiées et du total publié.Figure de James Wabenga Yango. Source : Comtrade et WITS de la Banque mondiale, statistiques miroir de 2023, relayées par Trading Economics ; les parts en pourcentage sont calculées à partir des valeurs publiées et du total publié.How to citeComment citer
The import side is less concentrated than the export side, and it carries a different risk. China supplies a quarter of imports, essentially equipment and manufactures; the Gulf supplies almost as much: the Emirates, Saudi Arabia, Bahrain, Qatar and Kuwait together account for 22.7 per cent, and that is the refined fuel bill. A country that imports its energy in dollars and exports its copper in dollars is hedged on the exchange rate and exposed on the terms of trade, since the two prices do not move together. Uganda and Rwanda do not appear among the first twenty-four suppliers, which does not mean that nothing crosses those borders: the trade of the eastern provinces is largely informal and escapes customs on both sides.Le versant des importations est moins concentré que celui des exportations, et il porte un risque d’une autre nature. La Chine fournit le quart des importations, pour l’essentiel des équipements et des produits manufacturés ; le Golfe fournit presque autant : Émirats, Arabie saoudite, Bahreïn, Qatar et Koweït réunis font 22,7 pour cent, et c’est la facture des carburants raffinés. Un pays qui importe son énergie en dollars et exporte son cuivre en dollars est couvert sur le change et exposé sur les termes de l’échange, les deux prix ne bougeant pas ensemble. L’Ouganda et le Rwanda ne figurent pas parmi les vingt-quatre premiers fournisseurs, ce qui ne veut pas dire que rien ne passe ces frontières : le commerce des provinces de l’Est est largement informel et échappe aux douanes des deux côtés.
Source:Source : Comtrade et WITS de la Banque mondiale, statistiques miroir de 2023, relayées par Trading Economics ; les parts en pourcentage sont calculées à partir des valeurs publiées et du total publié.
Table compiled by James Wabenga Yango.Tableau composé par James Wabenga Yango.How to citeComment citer
Trade concentration, by partnerConcentration des échanges, par partenaire
ReadingRelevé
ValueValeur
YearAnnée
Export partners, numberPartenaires à l’exportation, nombre
107.0107,0
2023
Import partners, numberPartenaires à l’importation, nombre
Export CR1, top partner, %CR1 exportations, premier partenaire, %
57.657,6
2023
Export CR3, top three partners, %CR3 exportations, trois premiers partenaires, %
74.774,7
2023
Export CR5, top five partners, %CR5 exportations, cinq premiers partenaires, %
85.385,3
2023
Import CR1, top partner, %CR1 importations, premier partenaire, %
26.526,5
2023
Import CR3, top three partners, %CR3 importations, trois premiers partenaires, %
46.546,5
2023
Import CR5, top five partners, %CR5 importations, cinq premiers partenaires, %
58.058,0
2023
Export Herfindahl-Hirschman index, ×100Indice de Herfindahl-Hirschman des exportations, ×100
44.044,0
2023
Import Herfindahl-Hirschman index, ×100, lower boundIndice de Herfindahl-Hirschman des importations, ×100, borne basse
10.310,3
2023
CR1, CR3 and CR5 are my own running sums of the shares published in the two tables above, not figures WITS or Comtrade publish directly; they read, for instance, as “the three largest export destinations take 74.7 per cent of goods exports.” The export Herfindahl-Hirschman index is WITS's own published figure for 2023 (country profile, Congo, Dem. Rep., code ZAR), rescaled by 100 so it sits on the same page as a percentage; WITS does not publish the matching import index, so the import figure here is a lower bound I compute from only the ten largest suppliers, each share squared and summed. The true import index is a little higher, because the residual 26.7 per cent of imports is spread across 169 smaller suppliers rather than one, so the gap to the true value stays small. The same caution does not carry over to the export side: a top-ten-only version of the same calculation gives 35.6, eight points below WITS's own 44.0, which says the true concentration already shows up fully within the ten largest buyers and is not an artefact of a long tail the way the import figure is; the gap is a property of WITS's own methodology, not of a longer tail outside the top ten, and is left unexplained rather than papered over.Les CR1, CR3 et CR5 sont mes propres sommes cumulées des parts publiées dans les deux tableaux qui précèdent, non des chiffres que WITS ou Comtrade publient directement ; ils se lisent, par exemple, comme « les trois premières destinations d’exportation prennent 74,7 pour cent des exportations de biens ». L’indice de Herfindahl-Hirschman des exportations est le chiffre publié par WITS lui-même pour 2023 (profil pays, Congo, Dem. Rep., code ZAR), remis à l’échelle par 100 pour figurer sur la même page qu’un pourcentage ; WITS ne publie pas l’indice correspondant pour les importations, si bien que le chiffre donné ici n’est qu’une borne basse, calculée à partir des dix premiers fournisseurs seulement, chaque part élevée au carré puis sommée. La valeur réelle est un peu plus élevée, car les 26,7 pour cent résiduels des importations se répartissent entre 169 fournisseurs plus modestes et non sur un seul, si bien que l’écart à la valeur réelle reste faible. La même prudence ne vaut pas du côté des exportations : la même méthode limitée aux dix premiers partenaires donne 35,6, soit huit points sous le 44,0 propre de WITS, ce qui indique que la concentration réelle apparaît déjà en entier dans les dix premiers acheteurs et ne tient pas, comme pour les importations, à une longue traîne hors du top dix ; l’écart tient à la méthode propre de WITS, non à une traîne plus longue hors du top dix, et il est signalé tel quel plutôt que lissé.
Source:Source : Comtrade et WITS de la Banque mondiale, statistiques miroir de 2023, relayées par Trading Economics ; les parts en pourcentage sont calculées à partir des valeurs publiées et du total publié.
Table compiled by James Wabenga Yango.Tableau composé par James Wabenga Yango.How to citeComment citer
External vulnerability, the readings that matterLa vulnérabilité extérieure, les relevés qui comptent
ReadingRelevé
ValueValeur
YearAnnée
Reserves, weeks of imports, IMFRéserves, semaines d’importations, FMI
10.110,1
2024
Reserves, months of imports, World BankRéserves, mois d’importations, Banque mondiale
1.71,7
2023
External debt, % of gross national incomeDette extérieure, % du revenu national brut
18.318,3
2024
Debt service, % of exportsService de la dette, % des exportations
1.31,3
2024
Net foreign direct investment, $mInvestissement direct étranger net, M$
2,915.02 915,0
2024
Remittances, % of GDPEnvois de fonds, % du PIB
3.73,7
2025
Fuels, % of merchandise importsCombustibles, % des importations de marchandises
36.536,5
2023
Food, % of merchandise importsProduits alimentaires, % des importations de marchandises
4.84,8
2023
Copper and cobalt, % of exportsCuivre et cobalt, % des exportations
86.686,6
2023
Ten largest firms, % of exportsDix premières entreprises, % des exportations
63.063,0
2023
China, % of exportsChine, % des exportations
57.657,6
2023
DRC share of world cobalt mining, %Part de la RD Congo dans l’extraction mondiale de cobalt, %
74.874,8
2024
DRC share of world copper mining, %Part de la RD Congo dans l’extraction mondiale de cuivre, %
13.013,0
2024
China share of world cobalt refining, %Part de la Chine dans le raffinage mondial du cobalt, %
79.079,0
2024
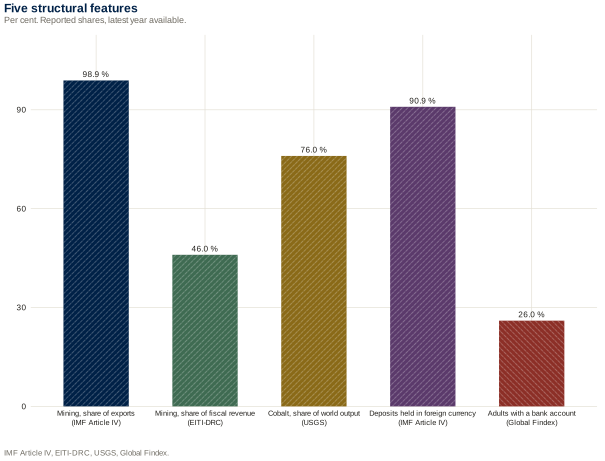
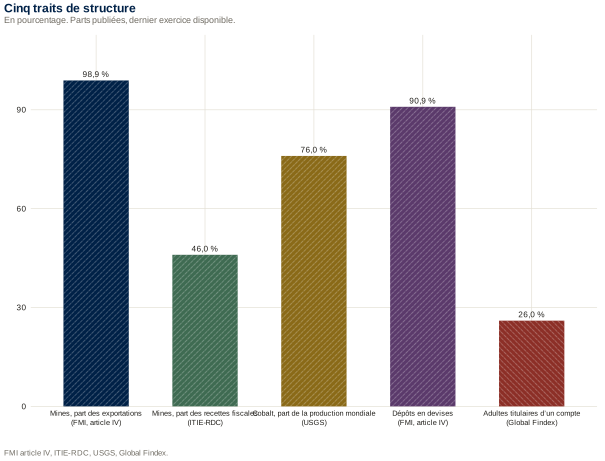
Read the table from the bottom. The DRC mines three quarters of the world's cobalt; China refines four fifths of it and buys more than half of all Congolese exports. That is not a market, it is a bilateral chain, and the price of cobalt is set at the refining end of it, not at the mining end. Above that, the concentration is threefold: in two products, in one buyer, and in ten firms, which together sell two thirds of what leaves the country. Then come the reserves, and they are the binding constraint: ten weeks of imports is a little over two months, against the three months normally taken as prudent, so an external shock has to be absorbed by the exchange rate rather than by the reserves. What the table does not show is a debt problem: at 18 per cent of national income and a debt service of 1.3 per cent of exports, the DRC is among the least indebted countries of the continent, an inheritance of the 2010 relief. The Congolese external risk is a price risk, not a repayment risk.Ce tableau se lit par le bas. La RD Congo extrait les trois quarts du cobalt mondial ; la Chine en raffine les quatre cinquièmes et achète plus de la moitié de toutes les exportations congolaises. Ce n’est pas un marché, c’est une chaîne bilatérale, et le prix du cobalt s’y forme du côté du raffinage, non du côté de la mine. Au-dessus, la concentration est triple : sur deux produits, sur un acheteur et sur dix entreprises, qui vendent ensemble les deux tiers de ce qui sort du pays. Viennent ensuite les réserves, et ce sont elles qui contraignent : dix semaines d’importations font un peu plus de deux mois, contre les trois mois que l’on tient d’ordinaire pour prudents, de sorte qu’un choc extérieur doit être absorbé par le taux de change plutôt que par les réserves. Ce que le tableau ne montre pas, c’est un problème de dette : à 18 pour cent du revenu national et avec un service de 1,3 pour cent des exportations, la RD Congo est parmi les pays les moins endettés du continent, héritage de l’allègement de 2010. Le risque extérieur congolais est un risque de prix, non un risque de remboursement.
Source:Source : Banque mondiale, Indicateurs du développement dans le monde, séries FI.RES.TOTL.MO, DT.DOD.DECT.GN.ZS, DT.TDS.DECT.EX.ZS, BX.KLT.DINV.CD.WD, BX.TRF.PWKR.DT.GD.ZS, TM.VAL.FUEL.ZS.UN et TM.VAL.FOOD.ZS.UN, extraction du 13 juillet 2026 ; FMI, rapports pays 24/227 et 25/195 ; United States Geological Survey, Mineral Commodity Summaries 2026 ; Cobalt Institute, Cobalt Market Report 2024. FMI, rapport pays 25/195, première revue du programme et consultation au titre de l’article IV, 2025 ; réserves internationales brutes en semaines d’importations.
Table compiled by James Wabenga Yango.Tableau composé par James Wabenga Yango.How to citeComment citer
Financing of the external position and debtFinancement de la position extérieure et dette
Figure by James Wabenga Yango. Source: FMI, République démocratique du Congo : deuxième revue des accords FEC et FRD, rapport pays nº 26/2, janvier 2026. Banque mondiale, Macro Poverty Outlook, édition d’avril 2026, fiche République démocratique du Congo ; seuils de pauvreté en parités de pouvoir d’achat de 2021.Figure de James Wabenga Yango. Source : FMI, République démocratique du Congo : deuxième revue des accords FEC et FRD, rapport pays nº 26/2, janvier 2026. Banque mondiale, Macro Poverty Outlook, édition d’avril 2026, fiche République démocratique du Congo ; seuils de pauvreté en parités de pouvoir d’achat de 2021.How to citeComment citer
Public debt, % of GDP (IMF)Dette publique, % du PIB (FMI)
Public debt, % of GDP (World Bank)Dette publique, % du PIB (Banque mondiale)
Reserves, $bnRéserves, milliards USD
2023
1,6681 668
17.217,2
18.118,1
27.427,4
5.425,42
2024
2,9152 915
14.114,1
20.920,9
22.922,9
6.736,73
2025
2,8612 861
11.811,8
18.118,1
21.121,1
8.298,29
2026
3,4013 401
14.014,0
20.520,5
21.621,6
—
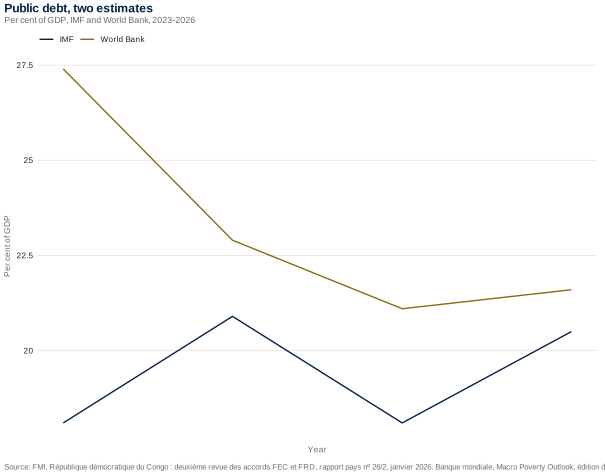
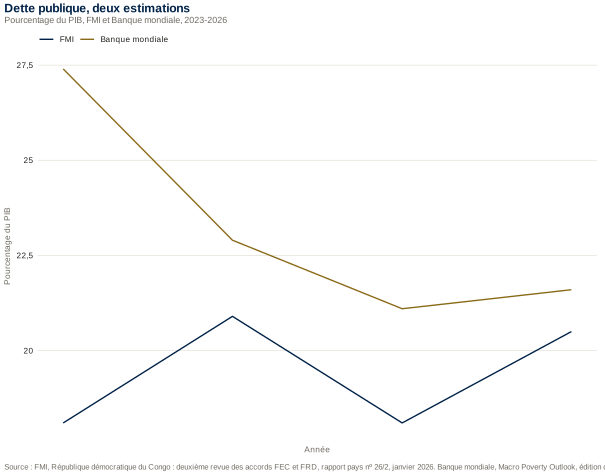
The two debt ratios differ by up to nine points of GDP because they do not cover the same perimeter; the Fund figure excludes part of the certified domestic arrears, which stood at about five billion dollars in 2024 and 2025. Reserves reached 8.8 billion dollars at the end of March 2026 and stood at 7.9 billion on 30 July 2026, that is three months of non-aid imports.Les deux ratios de dette diffèrent de neuf points de PIB au plus parce qu’ils ne couvrent pas le même périmètre ; le chiffre du Fonds laisse de côté une partie des arriérés intérieurs certifiés, qui atteignaient environ cinq milliards de dollars en 2024 et en 2025. Les réserves ont culminé à 8,8 milliards de dollars fin mars 2026 et s’établissaient à 7,9 milliards le 30 juillet 2026, soit trois mois d’importations hors aide.
Source:Source : FMI, République démocratique du Congo : deuxième revue des accords FEC et FRD, rapport pays nº 26/2, janvier 2026. Banque mondiale, Macro Poverty Outlook, édition d’avril 2026, fiche République démocratique du Congo ; seuils de pauvreté en parités de pouvoir d’achat de 2021.
Table compiled by James Wabenga Yango.Tableau composé par James Wabenga Yango.How to citeComment citer
National accounts: what is published and what is notComptes nationaux : ce qui est publié et ce qui ne l’est pas
Social accounting matrix, 47 branches, 2018Matrice de comptabilité sociale, 47 branches, 2018
Author’s work, not yet publishedTravaux de l’auteur, non encore publiés
Working paper in preparationDocument de travail en préparation
Expenditure side of GDPPIB par la dépense
Investment and saving onlyInvestissement et épargne seulement
IMF country report 26/2FMI, rapport pays 26/2
Household consumption, share of GDPConsommation des ménages, part du PIB
Not publishedNon publiée
Growth rate only, World BankTaux de croissance seulement, Banque mondiale
Gross fixed capital formation, share of GDPFormation brute de capital fixe, part du PIB
Not publishedNon publiée
Growth rate only, World BankTaux de croissance seulement, Banque mondiale
The DRC has produced a supply and use table and integrated economic accounts through the ERETES system, but neither is downloadable from a public source: the statistical institute’s portal announced its publication library as forthcoming when it was consulted in August 2026. The expenditure side is barely better served: the Fund publishes total investment and national saving, the Bank publishes growth rates for household consumption and for fixed capital formation, and nobody publishes either of those two as a share of output. This page therefore says nothing about the level of Congolese consumption, and the reason it says nothing is that no one has published it.La RD Congo a produit un tableau des ressources et des emplois et des comptes économiques intégrés au moyen du système ERETES, mais ni l’un ni les autres ne sont téléchargeables depuis une source publique : le portail de l’institut national de la statistique annonçait sa bibliothèque de publications comme à venir lorsqu’il a été consulté en août 2026. Le PIB par la dépense n’est guère mieux servi : le Fonds publie l’investissement total et l’épargne nationale, la Banque publie des taux de croissance de la consommation des ménages et de la formation brute de capital fixe, et personne ne publie ni l’une ni l’autre en part de la production. Cette page ne dit donc rien du niveau de la consommation congolaise, et si elle n’en dit rien, c’est que personne ne l’a publié.
Source:Source : Institut national de la statistique (insrdc.cd, consulté le 15 août 2026), Banque centrale du Congo, FMI, travaux de l’auteur.
Table compiled by James Wabenga Yango.Tableau composé par James Wabenga Yango.How to citeComment citer
Monthly panel of the DR Congo: series, transformations and testsLe panel mensuel de la RD Congo : séries, transformations et tests
SeriesSérie
GroupGroupe
TransformationTransformation
FromDébut
ToFin
ObservationsObservations
ADF t-statisticStatistique t de Dickey-Fuller
Seasonality, Kruskal-Wallis pSaisonnalité, p de Kruskal-Wallis
Consumer price index (Dec 2011 = 100)Indice des prix à la consommation (déc. 2011 = 100)
PricesPrix
100 × Δ log
2013-01
2025-08
152152
-3-3
0.990,99
Broad money, CDF millionMonnaie au sens large, millions de CDF
Money and creditMonnaie et crédit
100 × Δ log
2013-01
2025-08
152152
-12-12
0.000,00
International reservesRéserves internationales
Money and creditMonnaie et crédit
100 × Δ log
2013-01
2025-08
152152
-11-11
0.470,47
Exchange rate, CDF per US dollarTaux de change, CDF par dollar américain
Exchange rateChange
100 × Δ log
2013-01
2025-08
152152
-4-4
0.580,58
Policy rate, per centTaux directeur, en pourcentage
Money and creditMonnaie et crédit
Δ niveau
2013-01
2025-08
152152
-11-11
0.950,95
Trade balance, US$ millionSolde commercial, millions de dollars
TradeÉchanges
niveau
2013-01
2023-12
132132
-10-10
0.360,36
Federal funds rate, per centTaux des fonds fédéraux, en pourcentage
Modelled on the Canadian database of Fortin-Gagnon and co-authors: each series carries a transformation that makes it stationary (100 × log difference for prices, money, reserves, the exchange rate and commodity prices; first difference for interest rates; level for the trade balance, which changes sign). The augmented Dickey-Fuller statistic is below the 5 per cent critical value of −2.86 for every series, so the rule holds. A Kruskal-Wallis p below 0.05 flags residual seasonality in the transformed series: broad money, copper, palm oil and rubber. Nothing was seasonally adjusted. Eight monthly series of the site's working file (GDP, consumption, investment, exports, imports, revenue, expenditure, hours) are left out because they are smoothed from annual or quarterly data. The DR Congo has no monthly series for production, employment or housing, so the panel is made of prices, money, the exchange rate, trade and world conditions. Gaps are not filled. Files: data/panel/rdc_panel_brut.csv, rdc_panel_stationnaire.csv, rdc_panel_catalogue.csv.Construit sur le modèle de la base canadienne de Fortin-Gagnon et coauteurs : chaque série porte une transformation qui la rend stationnaire (100 × différence de logarithmes pour les prix, la monnaie, les réserves, le taux de change et les cours ; différence première pour les taux d’intérêt ; niveau pour le solde commercial, qui change de signe). La statistique de Dickey-Fuller augmentée passe sous la valeur critique de −2,86 à 5 % pour toutes les séries : la règle tient. Un p de Kruskal-Wallis inférieur à 0,05 signale une saisonnalité résiduelle dans la série transformée : monnaie large, cuivre, huile de palme et caoutchouc. Rien n’a été désaisonnalisé. Huit séries mensuelles du fichier de travail du site (PIB, consommation, investissement, exportations, importations, recettes, dépenses, heures) sont écartées parce qu’elles sont lissées à partir de données annuelles ou trimestrielles. La RD Congo n’a pas de série mensuelle de production, d’emploi ou de logement : le panel se compose de prix, de monnaie, de change, d’échanges et de conditions mondiales. Les trous ne sont pas comblés. Fichiers : data/panel/rdc_panel_brut.csv, rdc_panel_stationnaire.csv, rdc_panel_catalogue.csv.
Source:Source : Fortin-Gagnon, Leroux, Stevanovic et Surprenant (2022), Canadian Journal of Economics 55 : 1799-1833, pour la méthode ; sources des séries : BCC, INS, Banque mondiale (Pink Sheet), Réserve fédérale ; calculs de l’auteur.
Table compiled by James Wabenga Yango.Tableau composé par James Wabenga Yango.How to citeComment citer
How much of the panel a few common factors carryCe que portent quelques facteurs communs du panel
Figure by James Wabenga Yango. Source: Fortin-Gagnon, Leroux, Stevanovic et Surprenant (2022), Canadian Journal of Economics 55 : 1799-1833, pour la méthode ; sources des séries : BCC, INS, Banque mondiale (Pink Sheet), Réserve fédérale ; calculs de l’auteur.Figure de James Wabenga Yango. Source : Fortin-Gagnon, Leroux, Stevanovic et Surprenant (2022), Canadian Journal of Economics 55 : 1799-1833, pour la méthode ; sources des séries : BCC, INS, Banque mondiale (Pink Sheet), Réserve fédérale ; calculs de l’auteur.How to citeComment citer
Principal components of the balanced panel of 19 series, 2013-02 to 2023-12 (131 months), standardised and transformed. The first component carries 22.6 per cent of the variance and loads mostly on the metal prices; the first four carry 50.4 per cent. The Canadian database is far more factorial because it has hundreds of series that move with one business cycle; here the series are few and driven by different forces.Composantes principales du panel équilibré de 19 séries, de 2013-02 à 2023-12 (131 mois), standardisées et transformées. La première composante porte 22,6 % de la variance et charge surtout les cours des métaux ; les quatre premières en portent 50,4 %. La base canadienne est bien plus factorielle, parce que ses centaines de séries suivent un même cycle ; ici les séries sont peu nombreuses et obéissent à des forces différentes.
Source:Source : Fortin-Gagnon, Leroux, Stevanovic et Surprenant (2022), Canadian Journal of Economics 55 : 1799-1833, pour la méthode ; sources des séries : BCC, INS, Banque mondiale (Pink Sheet), Réserve fédérale ; calculs de l’auteur.
Table compiled by James Wabenga Yango.Tableau composé par James Wabenga Yango.How to citeComment citer
GDP per head, 1960-2025: output growth, population growth and living standardsLe PIB par habitant, 1960-2025 : croissance de la production, croissance démographique et niveau de vie
Figure by James Wabenga Yango. Source: World Bank, World Development Indicators; author's calculations.Figure de James Wabenga Yango. Source : Banque mondiale, World Development Indicators ; calculs de l’auteur.How to citeComment citer
Figure by James Wabenga Yango. Source: World Bank, World Development Indicators; author's calculations.Figure de James Wabenga Yango. Source : Banque mondiale, World Development Indicators ; calculs de l’auteur.How to citeComment citer
Figure by James Wabenga Yango. Source: World Bank, World Development Indicators; author's calculations.Figure de James Wabenga Yango. Source : Banque mondiale, World Development Indicators ; calculs de l’auteur.How to citeComment citer
GDP per head, start, 2015 dollarsPIB par habitant, début, dollars de 2015
GDP per head, end, 2015 dollarsPIB par habitant, fin, dollars de 2015
1960-1975
2.812,81
2.782,78
0.030,03
1,3031 303
1,3101 310
1975-1990
0.080,08
3.153,15
-2.98-2,98
1,3101 310
832832
1990-2002
-4.63-4,63
3.233,23
-7.62-7,62
832832
321321
2002-2025
5.865,86
3.283,28
2.502,50
321321
568568
1960-2025
1.821,82
3.133,13
-1.27-1,27
1,3031 303
568568
Output per head is real GDP divided by population, so its growth rate equals the growth of GDP minus the growth of population (the third column is the first minus the second, up to rounding of compounded rates). The level of living standards, measured by output per head, peaked at 1 415 dollars of 2015 in 1974 and bottomed at 321 in 2002, a fall of 77 per cent. Three facts organise the table. First, population grew at 2.8 to 3.3 per cent a year in every period, so the burden on output is constant and about three points: GDP must grow faster than three per cent just to hold living standards. Second, the whole divergence of living standards is a story of output, not of population: between 1975 and 1990 output stagnated, then fell by 4.6 per cent a year in 1990-2002, and per-head output fell by 3,0 and 7,6 per cent a year. Third, the recovery since 2002 is real, 2,5 per cent a year per head, yet 2025 output per head, 568 dollars, remains 56 per cent below its 1960 level. Per-head output at purchasing power parity, the better guide to living standards, went from 2 404 in 1990 to 929 in 2002 and 1 641 in 2025 (constant international dollars), the same shape. The high fertility rate means demographic growth will keep absorbing roughly three points of growth for decades; closing the gap needs sustained growth well above that.Le produit par habitant est le PIB réel divisé par la population ; son taux de croissance égale donc celui du PIB moins celui de la population (la troisième colonne est la première moins la deuxième, aux arrondis près des taux composés). Le niveau de vie, mesuré par le produit par habitant, a culminé à 1 415 dollars de 2015 en 1974 et touché le fond à 321 en 2002, soit une chute de 77 pour cent. Trois faits organisent le tableau. D'abord, la population a crû de 2,8 à 3,3 pour cent par an dans toutes les périodes : le fardeau sur la production est constant, d'environ trois points, et le PIB doit croître de plus de trois pour cent rien que pour maintenir le niveau de vie. Ensuite, toute la divergence du niveau de vie est une affaire de production et non de population : entre 1975 et 1990 la production a stagné, puis reculé de 4,6 pour cent par an en 1990-2002, et le produit par habitant a baissé de 3,0 et de 7,6 pour cent par an. Enfin, la reprise depuis 2002 est réelle, 2,5 pour cent par an par habitant, mais le produit par habitant de 2025, 568 dollars, reste inférieur de 56 pour cent à celui de 1960. À parité de pouvoir d'achat, meilleur guide du niveau de vie, le produit par habitant est passé de 2 404 en 1990 à 929 en 2002 et 1 641 en 2025 (dollars internationaux constants), selon la même forme. La fécondité élevée fait que la croissance démographique continuera d'absorber environ trois points de croissance pendant des décennies ; combler l'écart exige une croissance soutenue bien supérieure.
Source:Source : Banque mondiale, World Development Indicators (SP.POP.TOTL, NY.GDP.MKTP.KD, NY.GDP.PCAP.PP.KD), série annuelle 1960-2025 ; calculs de l’auteur.
Table compiled by James Wabenga Yango.Tableau composé par James Wabenga Yango.How to citeComment citer
Which series exist over a longer span or at higher frequency than the site showsQuelles séries existent sur une période plus longue ou à plus haute fréquence que celle du site
TopicThème
On the siteSur le site
Longest series foundPlus longue série trouvée
StatusStatut
PopulationPopulation
2024-2025 and provinces 20262024-2025 et provinces 2026
1960-2025, annual1960-2025, annuelle
Verified on 8 October 2026 (World Bank API)Vérifié le 8 octobre 2026 (API Banque mondiale)
Refugees and displaced personsRéfugiés et déplacés
Latest countsDerniers relevés
UNHCR and IDMC series exist but were not retrieved hereDes séries du HCR et de l’IDMC existent mais n’ont pas été récupérées ici
To be verifiedÀ vérifier
Of the twenty-one topics, sixteen have an annual series spanning 30 to 66 years in the World Bank database that the site does not yet use in full; the exchange rate, broad money, reserves, trade and life expectancy are the most useful for the analysis, because they cover the hyperinflation of the 1990s and the crisis of 1975-2002 that the shorter series miss. Two limits matter. First, poverty has three survey years and no long series exists; any claim on its long run is an inference. Second, no quarterly national accounts are published, so business-cycle statements rest on annual data or on monthly proxies (prices, money, reserves, copper). High-frequency series (monthly consumer prices, exchange rate, policy rate, commodity prices) are already used in the monthly panel.Sur les vingt et un thèmes, seize disposent dans la base de la Banque mondiale d’une série annuelle couvrant 30 à 66 ans que le site n’exploite pas encore entièrement ; le taux de change, la monnaie large, les réserves, le commerce et l’espérance de vie sont les plus utiles à l’analyse, car ils couvrent l’hyperinflation des années 1990 et la crise de 1975-2002 que les séries courtes ne voient pas. Deux limites comptent. D’abord, la pauvreté n’a que trois années d’enquête et aucune longue série n’existe : toute affirmation sur son long terme est une inférence. Ensuite, aucun compte national trimestriel n’est publié, de sorte que les énoncés sur le cycle reposent sur des données annuelles ou sur des indicateurs mensuels (prix, monnaie, réserves, cuivre). Les séries à haute fréquence (prix à la consommation mensuels, taux de change, taux directeur, cours des matières premières) sont déjà dans le panel mensuel.
Source:Source : API de la Banque mondiale (World Development Indicators), interrogée le 8 octobre 2026 ; pages bcc.cd/statistiques ; inventaire de l’auteur.
Table compiled by James Wabenga Yango.Tableau composé par James Wabenga Yango.How to citeComment citer
The state, the mine and the currencyL’État, la mine et la monnaie
The Congolese budget collects about fourteen per cent of output and spends about seventeen, and between a third and a half of what it collects comes out of the ground. That single proportion is why the fiscal stance in the DRC is not chosen so much as received: it moves with the copper and cobalt cycle, and the deficit widens when the cycle turns. The monetary table alongside records the disinflation of 2023 to 2025 and the exchange rate that accompanied it, together with a dollarisation ratio around ninety per cent which is what limits the transmission of any policy rate the central bank sets.
Le budget congolais prélève quelque quatorze pour cent de la production et en dépense environ dix-sept, et entre le tiers et la moitié de ce qu’il prélève sort du sol. Cette seule proportion explique que l’orientation budgétaire en RD Congo soit moins choisie que subie : elle suit le cycle du cuivre et du cobalt, et le déficit se creuse quand le cycle se retourne. Le tableau monétaire qui l’accompagne enregistre la désinflation de 2023 à 2025 et le taux de change qui l’a accompagnée, avec un taux de dollarisation voisin de quatre-vingt-dix pour cent qui limite la transmission de tout taux directeur que fixe la banque centrale.
Central government operations, per cent of GDPOpérations de l’État, en pourcentage du PIB
Figure by James Wabenga Yango. Source: FMI, République démocratique du Congo : deuxième revue des accords FEC et FRD, rapport pays nº 26/2, janvier 2026. Les années 2016 à 2018 proviennent du rapport pays nº 19/285 (article IV de 2019).Figure de James Wabenga Yango. Source : FMI, République démocratique du Congo : deuxième revue des accords FEC et FRD, rapport pays nº 26/2, janvier 2026. Les années 2016 à 2018 proviennent du rapport pays nº 19/285 (article IV de 2019).How to citeComment citer
Figure by James Wabenga Yango. Source: Banque mondiale, rapports pays sur le Zaïre : nº 821-ZR, The Economy of Zaire ; nº 1407-ZR, Economic Conditions and Prospects of Zaire ; nº 2518-ZR et nº 3287-ZR et nº 4077-ZR, Zaire Economic Memorandum (20 mai 1981 pour le nº 3287-ZR) ; nº 8995-ZR, A Review of Government Expenditure, 7 juin 1991. Recoupé avec Euromoney, « Erwin Blumenthal is Zaire's last hope », février 1979, pour le déficit de 1977.Figure de James Wabenga Yango. Source : Banque mondiale, rapports pays sur le Zaïre : nº 821-ZR, The Economy of Zaire ; nº 1407-ZR, Economic Conditions and Prospects of Zaire ; nº 2518-ZR et nº 3287-ZR et nº 4077-ZR, Zaire Economic Memorandum (20 mai 1981 pour le nº 3287-ZR) ; nº 8995-ZR, A Review of Government Expenditure, 7 juin 1991. Recoupé avec Euromoney, « Erwin Blumenthal is Zaire's last hope », février 1979, pour le déficit de 1977.How to citeComment citer
The years 2019 to 2022 are missing because the Fund vintages consulted do not restate them on the revised national accounts; splicing them in from the old series would put non-comparable ratios side by side. Ratios up to 2018 rest on the old GDP series and should be read as orders of magnitude. Expenditure carries an exceptional line, security and elections, which the Fund reports separately: 2.9 points of GDP in 2023, 2.3 in 2024 and 3.5 in 2025. Total revenue and expenditure in 2024 were 29,820 and 35,519 billion Congolese francs.Les années 2019 à 2022 manquent parce que les millésimes du Fonds consultés ne les rétablissent pas sur les comptes nationaux révisés ; les reprendre de l’ancienne série reviendrait à juxtaposer des ratios non comparables. Les ratios antérieurs à 2019 reposent sur l’ancienne série de PIB et se lisent comme des ordres de grandeur. Les dépenses comportent une ligne exceptionnelle, sécurité et élections, que le Fonds isole : 2,9 points de PIB en 2023, 2,3 en 2024 et 3,5 en 2025. Les recettes et les dépenses totales de 2024 se sont élevées à 29 820 et 35 519 milliards de francs congolais.
Source:Source : FMI, République démocratique du Congo : deuxième revue des accords FEC et FRD, rapport pays nº 26/2, janvier 2026. Les années 2016 à 2018 proviennent du rapport pays nº 19/285 (article IV de 2019).
Table compiled by James Wabenga Yango.Tableau composé par James Wabenga Yango.How to citeComment citer
Central government revenue, Zaïre, 1968–1989Recettes de l’État, Zaïre, 1968–1989
Figure by James Wabenga Yango. Source: Banque mondiale, rapports pays sur le Zaïre : nº 821-ZR, The Economy of Zaire ; nº 1407-ZR, Economic Conditions and Prospects of Zaire ; nº 2518-ZR et nº 3287-ZR et nº 4077-ZR, Zaire Economic Memorandum (20 mai 1981 pour le nº 3287-ZR) ; nº 8995-ZR, A Review of Government Expenditure, 7 juin 1991. Recoupé avec Euromoney, « Erwin Blumenthal is Zaire's last hope », février 1979, pour le déficit de 1977.Figure de James Wabenga Yango. Source : Banque mondiale, rapports pays sur le Zaïre : nº 821-ZR, The Economy of Zaire ; nº 1407-ZR, Economic Conditions and Prospects of Zaire ; nº 2518-ZR et nº 3287-ZR et nº 4077-ZR, Zaire Economic Memorandum (20 mai 1981 pour le nº 3287-ZR) ; nº 8995-ZR, A Review of Government Expenditure, 7 juin 1991. Recoupé avec Euromoney, « Erwin Blumenthal is Zaire's last hope », février 1979, pour le déficit de 1977.How to citeComment citer
Current revenue, Z millionRecettes courantes, millions de zaïres
Per cent of GDPEn % du PIB
1968
184.7184,7
—
1969
272.7272,7
—
1970
306.9306,9
38.138,1
1971
292.2292,2
—
1972
301.1301,1
—
1973
387.4387,4
—
1974
534.4534,4
—
1975
404.8404,8
—
1976
731.0731,0
—
1977
—
19.319,3
1978
—
—
1979
1,976.01 976,0
22.822,8
1980
3,777.03 777,0
28.428,4
1981
4,802.04 802,0
24.724,7
1982
—
—
1983
—
—
1984
—
—
1985
—
—
1986
—
—
1987
—
—
1988
—
—
1989
—
—
No estimated values appear in this table: a dash means the figure is not available in the reports consulted. Three gaps matter for anyone tempted to splice this series onto a modern one. First, 1982–1989 has no annual figure at all; the only published numbers for that decade are three-year averages of revenue as a share of GDP (8.0% in 1981–83, 10.2% in 1984–86, 9.7% in 1987–89, World Bank Report No. 8995-ZR). Second, for several years the Bank's own reports disagree with each other: 1973 is given as 373.5, 382.5 or 387.4 Z million depending on the report and the revenue definition used; 1974 ranges from 534.4 to 810.5 Z million, a gap of more than 50%; 1978 is cited at both 15.5% and roughly 25% of GDP in two different Bank memoranda. The value kept here is the one from the most directly comparable series for the surrounding years, not a judgment that it is the correct one. Third, ratios before 1982 rest on “commercialized GDP,” a narrower denominator than total GDP, and are not comparable without adjustment to a ratio computed on total GDP. The currency is the first zaïre (Z), replaced by the second zaïre in 1993 and by the Congolese franc in 1998; neither the amounts nor, for the reasons above, the ratios can be chained onto the post-1990 series in the table above it without first testing whether the two periods share the same fiscal regime.Aucune valeur n’est estimée dans ce tableau : un tiret signifie que le chiffre ne figure pas dans les rapports consultés. Trois lacunes comptent pour qui serait tenté de raccorder cette série à une série moderne. D’abord, 1982–1989 ne comporte aucun chiffre annuel : les seuls chiffres publiés pour cette décennie sont des moyennes triennales des recettes en pourcentage du PIB (8,0% en 1981-83, 10,2% en 1984-86, 9,7% en 1987-89, Banque mondiale, rapport n° 8995-ZR). Ensuite, pour plusieurs années, les rapports de la Banque se contredisent entre eux : 1973 est donné à 373,5, 382,5 ou 387,4 millions de zaïres selon le rapport et la définition des recettes retenue ; 1974 va de 534,4 à 810,5 millions de zaïres, un écart de plus de 50% ; 1978 est cité à la fois à 15,5% et à environ 25% du PIB dans deux mémorandums distincts de la Banque. La valeur retenue ici est celle de la série la plus directement comparable aux années voisines, non un jugement qu’elle serait la bonne. Enfin, les ratios antérieurs à 1982 reposent sur le « PIB commercialisé », un dénominateur plus étroit que le PIB total, et ne sont pas comparables sans ajustement à un ratio calculé sur le PIB total. La monnaie est le premier zaïre (Z), remplacé par le second zaïre en 1993 puis par le franc congolais en 1998 ; ni les montants, ni, pour les raisons ci-dessus, les ratios ne peuvent être chaînés à la série post-1990 du tableau précédent sans avoir d’abord testé si les deux périodes relèvent du même régime budgétaire.
Source:Source : Banque mondiale, rapports pays sur le Zaïre : nº 821-ZR, The Economy of Zaire ; nº 1407-ZR, Economic Conditions and Prospects of Zaire ; nº 2518-ZR et nº 3287-ZR et nº 4077-ZR, Zaire Economic Memorandum (20 mai 1981 pour le nº 3287-ZR) ; nº 8995-ZR, A Review of Government Expenditure, 7 juin 1991. Recoupé avec Euromoney, « Erwin Blumenthal is Zaire's last hope », février 1979, pour le déficit de 1977.
Table compiled by James Wabenga Yango.Tableau composé par James Wabenga Yango.How to citeComment citer
Extractive revenue and the budgetRecettes extractives et budget
Figure by James Wabenga Yango. Source: FMI, République démocratique du Congo : deuxième revue des accords FEC et FRD, rapport pays nº 26/2, janvier 2026. ITIE-RDC, rapport final 2023 (signé le 31 décembre 2025) et rapport de cadrage 2024.Figure de James Wabenga Yango. Source : FMI, République démocratique du Congo : deuxième revue des accords FEC et FRD, rapport pays nº 26/2, janvier 2026. ITIE-RDC, rapport final 2023 (signé le 31 décembre 2025) et rapport de cadrage 2024.How to citeComment citer
Share of total revenue, %Part des recettes totales, %
EITI extractive revenue, $bnRecettes extractives ITIE, milliards USD
2023
8,8368 836
5.25,2
39.139,1
5.3785,378
2024
12,32512 325
5.75,7
41.341,3
6.8196,819
2025
12,60012 600
5.25,2
37.737,7
—
2026
13,22513 225
4.94,9
34.934,9
—
The Fund’s extractive line covers mining and petroleum tax and non-tax revenue, royalties from the Sicomines agreement included. The share of total revenue is my own ratio of two published Fund lines, not a figure the Fund publishes. The EITI column is not the same aggregate: it reconciles company payments with government receipts, and mining alone accounted for 6.453 billion dollars of the 2024 total. Two independent sources therefore say the same thing, that between a third and a half of what the Congolese state collects comes out of the ground.La ligne extractive du Fonds couvre les recettes fiscales et non fiscales des mines et des hydrocarbures, redevances de la convention Sicomines comprises. La part des recettes totales est mon propre rapport de deux lignes publiées par le Fonds, non un chiffre que le Fonds publie. La colonne ITIE ne recouvre pas le même agrégat : elle rapproche les paiements des entreprises des encaissements de l’État, et les mines seules comptent pour 6,453 milliards de dollars du total de 2024. Deux sources indépendantes disent donc la même chose : entre le tiers et la moitié de ce que perçoit l’État congolais sort du sol.
Source:Source : FMI, République démocratique du Congo : deuxième revue des accords FEC et FRD, rapport pays nº 26/2, janvier 2026. ITIE-RDC, rapport final 2023 (signé le 31 décembre 2025) et rapport de cadrage 2024.
Table compiled by James Wabenga Yango.Tableau composé par James Wabenga Yango.How to citeComment citer
Prices, exchange rate and moneyPrix, taux de change et monnaie
Figure by James Wabenga Yango. Source: FMI, République démocratique du Congo : deuxième revue des accords FEC et FRD, rapport pays nº 26/2, janvier 2026. Banque centrale du Congo, cours indicatif et cours parallèle ; Institut national de la statistique, relevé hebdomadaire des prix.Figure de James Wabenga Yango. Source : FMI, République démocratique du Congo : deuxième revue des accords FEC et FRD, rapport pays nº 26/2, janvier 2026. Banque centrale du Congo, cours indicatif et cours parallèle ; Institut national de la statistique, relevé hebdomadaire des prix.How to citeComment citer
Inflation, period average, %Inflation, moyenne annuelle, %
Inflation, end of period, %Inflation, fin de période, %
CDF per USD, averageCDF par USD, moyenne
CDF per USD, end of periodCDF par USD, fin de période
Broad money growth, %Croissance de M2, %
FX share of deposits, %Part des dépôts en devises, %
2023
19.919,9
23.823,8
2,4442 444
2,6872 687
40.340,3
89.889,8
2024
17.717,7
11.711,7
2,8232 823
2,8562 856
28.228,2
91.691,6
2025
7.77,7
4.34,3
2,6882 688
2,3002 300
4.04,0
90.090,0
2026
4.44,4
6.16,1
—
—
9.19,1
—
Disinflation between 2023 and 2025 is the sharpest of the past decade and coincides with a franc that appreciated by about a fifth between August and October 2025, after the central bank revalued the franc-denominated reserve requirement on foreign currency deposits. The indicative rate stood near 2,250 francs to the dollar in July 2026 and the parallel rate at 2,266 in June, a spread narrow enough to be unremarkable. The dollarisation ratio is my own computation from the Fund’s monetary survey; no institution publishes it as such. The high-frequency price series published weekly by the statistical institute and by the central bank do not agree on the cumulative figure for 2026, and the difference is material.La désinflation de 2023 à 2025 est la plus vive de la décennie ; elle coïncide avec un franc apprécié d’un cinquième environ entre août et octobre 2025, après que la banque centrale eut réévalué la réserve obligatoire libellée en francs sur les dépôts en devises. Le cours indicatif avoisinait 2 250 francs pour un dollar en juillet 2026 et le cours parallèle 2 266 en juin, écart assez étroit pour ne rien signifier. Le taux de dollarisation est mon propre calcul à partir de la situation monétaire du Fonds ; aucune institution ne le publie tel quel. Les relevés de prix à haute fréquence publiés chaque semaine par l’institut de la statistique et par la banque centrale ne concordent pas sur le cumul de 2026, et l’écart n’est pas négligeable.
Source:Source : FMI, République démocratique du Congo : deuxième revue des accords FEC et FRD, rapport pays nº 26/2, janvier 2026. Banque centrale du Congo, cours indicatif et cours parallèle ; Institut national de la statistique, relevé hebdomadaire des prix.
Table compiled by James Wabenga Yango.Tableau composé par James Wabenga Yango.How to citeComment citer
Broad money, rebuilt from the balance sheets of the central bank and the banksLa monnaie au sens large, reconstituée à partir des bilans de la banque centrale et des banques
Figure by James Wabenga Yango. Source: Banque centrale du Congo, Rapport annuel 2024 (tableaux I|1|3, I|1|20, I|1|35, I|2|15 et I|4|9) ; calculs de l’auteur.Figure de James Wabenga Yango. Source : Banque centrale du Congo, Rapport annuel 2024 (tableaux I|1|3, I|1|20, I|1|35, I|2|15 et I|4|9) ; calculs de l’auteur.How to citeComment citer
Figure by James Wabenga Yango. Source: Banque centrale du Congo, Rapport annuel 2024 (tableaux I|1|3, I|1|20, I|1|35, I|2|15 et I|4|9) ; calculs de l’auteur.Figure de James Wabenga Yango. Source : Banque centrale du Congo, Rapport annuel 2024 (tableaux I|1|3, I|1|20, I|1|35, I|2|15 et I|4|9) ; calculs de l’auteur.How to citeComment citer
Figure by James Wabenga Yango. Source: Banque centrale du Congo, Rapport annuel 2024 (tableaux I|1|3, I|1|20, I|1|35, I|2|15 et I|4|9) ; calculs de l’auteur.Figure de James Wabenga Yango. Source : Banque centrale du Congo, Rapport annuel 2024 (tableaux I|1|3, I|1|20, I|1|35, I|2|15 et I|4|9) ; calculs de l’auteur.How to citeComment citer
Broad money, CDF bnMonnaie au sens large, milliards CDF
Growth, %Croissance, %
Of which net foreign assets, pointsDont avoirs extérieurs nets, points
Of which net domestic assets, pointsDont avoirs intérieurs nets, points
Real growth, %Croissance réelle, %
Broad money, % of GDPMonnaie large, % du PIB
Private credit, % of GDPCrédit au secteur privé, % du PIB
VelocityVitesse de circulation
Money multiplierMultiplicateur monétaire
2015
4,1304 130
—
—
—
—
11.811,8
5.85,8
—
3.313,31
2016
5,0795 079
23.023,0
-6.1-6,1
29.129,1
10.610,6
13.513,5
7.17,1
8.158,15
3.183,18
2017
7,2487 248
42.742,7
31.431,4
11.311,3
-7.8-7,8
13.013,0
5.75,7
9.039,03
3.743,74
2018
9,2089 208
27.127,1
10.310,3
16.716,7
18.518,5
11.911,9
5.55,5
9.389,38
3.743,74
2019
12,51412 514
35.935,9
17.517,5
18.418,4
29.929,9
14.714,7
5.75,7
7.857,85
3.553,55
2020
18,26118 261
45.945,9
39.139,1
6.86,8
26.026,0
20.220,2
7.17,1
5.865,86
5.005,00
2021
24,95724 957
36.736,7
41.441,4
-4.7-4,7
29.829,8
22.722,7
6.96,9
5.105,10
4.634,63
2022
25,82725 827
3.53,5
-7.0-7,0
10.410,4
-8.5-8,5
19.619,6
8.58,5
5.205,20
3.463,46
2023
36,23136 231
40.340,3
19.919,9
20.320,3
13.313,3
22.122,1
11.311,3
5.285,28
4.074,07
2024
46,40346 403
28.128,1
23.023,0
5.15,1
14.714,7
23.223,2
12.112,1
4.834,83
4.404,40
Rebuilt from the monetary survey of the depository institutions and the central bank’s own balance sheet, as the Banque centrale du Congo publishes them in the standardised reporting form. Two accounting identities are checked for every year and hold to the franc: net foreign assets plus net domestic assets equal broad money, and currency plus transferable deposits plus other deposits equal broad money. The two contribution columns are the change in each side divided by broad money of the year before, so they add up to growth. Broad money includes deposits in foreign currency, valued at the exchange rate of the end of the year; a depreciation therefore raises it without any new credit, and in 2020 and 2021 net foreign assets alone account for 39 and 41 of the 46 and 37 points of growth. Velocity is nominal GDP over the average of broad money at the two ends of the year, and it has fallen from 9.4 in 2018 to 4.8 in 2024 while broad money doubled as a share of output. The multiplier is broad money over the central bank’s monetary base. Real growth deflates by the December-to-December consumer price index. The central bank marks its most recent figures as provisional or estimated.Reconstitué à partir de la situation monétaire des institutions de dépôts et du bilan propre de la banque centrale, tels que la Banque centrale du Congo les publie dans le format standardisé. Deux identités comptables sont vérifiées chaque année et tiennent au franc près : avoirs extérieurs nets plus avoirs intérieurs nets égalent la monnaie au sens large, et numéraire plus dépôts transférables plus autres dépôts l’égalent aussi. Les deux colonnes de contribution rapportent la variation de chaque côté à la monnaie large de l’année précédente, de sorte qu’elles somment à la croissance. La monnaie large comprend les dépôts en devises, évalués au cours de fin d’année : une dépréciation la gonfle sans aucun crédit nouveau, et en 2020 et 2021 les seuls avoirs extérieurs nets expliquent 39 et 41 des 46 et 37 points de croissance. La vitesse est le PIB nominal rapporté à la moyenne de la monnaie large aux deux bouts de l’année ; elle est tombée de 9,4 en 2018 à 4,8 en 2024 tandis que la monnaie large doublait en proportion de la production. Le multiplicateur est la monnaie large rapportée à la base monétaire de la banque centrale. La croissance réelle déflate par l’indice des prix de décembre à décembre. La banque centrale signale ses chiffres les plus récents comme provisoires ou estimés.
Source:Source : Banque centrale du Congo, Rapport annuel 2024 (tableaux I|1|3, I|1|20, I|1|35, I|2|15 et I|4|9) ; calculs de l’auteur.
Table compiled by James Wabenga Yango.Tableau composé par James Wabenga Yango.How to citeComment citer
The central bank’s own balance sheet: reserves, domestic assets and the monetary baseLe bilan propre de la banque centrale : réserves, actifs intérieurs et base monétaire
Figure by James Wabenga Yango. Source: Banque centrale du Congo, Rapport annuel 2024 (tableaux I|1|3, I|1|20, I|1|35, I|2|15 et I|4|9) ; calculs de l’auteur.Figure de James Wabenga Yango. Source : Banque centrale du Congo, Rapport annuel 2024 (tableaux I|1|3, I|1|20, I|1|35, I|2|15 et I|4|9) ; calculs de l’auteur.How to citeComment citer
Currency in circulation, CDF bnCirculation fiduciaire, milliards CDF
Base growth, %Croissance de la base, %
2015
111111
1,1361 136
814814
1,2471 247
868868
—
2016
-449-449
2,0452 045
1,3241 324
1,5961 596
1,1531 153
27.927,9
2017
-571-571
2,5072 507
1,2721 272
1,9361 936
1,4551 455
21.321,3
2018
-311-311
2,7742 774
1,5021 502
2,4632 463
1,6901 690
27.227,2
2019
-79-79
3,6063 606
2,1042 104
3,5273 527
1,9341 934
43.243,2
2020
-543-543
4,1994 199
2,3182 318
3,6553 655
2,4492 449
3.63,6
2021
2,9892 989
2,4002 400
1,5281 528
5,3895 389
3,0453 045
47.447,4
2022
4,5244 524
2,9312 931
2,7702 770
7,4557 455
3,7973 797
38.338,3
2023
6,6606 660
2,2442 244
3,4513 451
8,9048 904
4,8324 832
19.419,4
2024
10,34110 341
211211
2,7432 743
10,55210 552
5,4945 494
18.518,5
The balance sheet of the Banque centrale du Congo alone, before consolidation with the banks. In every year, net foreign assets plus net domestic assets equal the monetary base published in the same table, to the franc. Net foreign assets were negative from 2016 to 2020 and stood at 10.3 trillion francs in 2024, which is almost the whole of the 10.6 trillion base: the base is now backed almost entirely by foreign assets. Net claims on the central government peaked at 3.5 trillion in 2023 and fell to 2.7 trillion in 2024, but other net items of the balance sheet offset them, so that net domestic assets stand at only 0.2 trillion.Le bilan de la seule Banque centrale du Congo, avant consolidation avec les banques. Chaque année, les avoirs extérieurs nets plus les avoirs intérieurs nets égalent la base monétaire publiée dans le même tableau, au franc près. Les avoirs extérieurs nets étaient négatifs de 2016 à 2020 et atteignaient 10,3 mille milliards de francs en 2024, soit presque toute la base de 10,6 mille milliards : la base est désormais adossée presque entièrement à des avoirs extérieurs. Les créances nettes sur l’administration centrale ont culminé à 3,5 mille milliards en 2023 et sont revenues à 2,7 en 2024, mais d’autres postes nets du bilan les compensent, si bien que les avoirs intérieurs nets ne sont que de 0,2 mille milliard.
Source:Source : Banque centrale du Congo, Rapport annuel 2024 (tableaux I|1|3, I|1|20, I|1|35, I|2|15 et I|4|9) ; calculs de l’auteur.
Table compiled by James Wabenga Yango.Tableau composé par James Wabenga Yango.How to citeComment citer
The public accounts as the central bank integrates themLes comptes publics tels que la banque centrale les intègre
Figure by James Wabenga Yango. Source: Banque centrale du Congo, Rapport annuel 2024 (tableaux I|1|3, I|1|20, I|1|35, I|2|15 et I|4|9) ; calculs de l’auteur.Figure de James Wabenga Yango. Source : Banque centrale du Congo, Rapport annuel 2024 (tableaux I|1|3, I|1|20, I|1|35, I|2|15 et I|4|9) ; calculs de l’auteur.How to citeComment citer
Figure by James Wabenga Yango. Source: Banque centrale du Congo, Rapport annuel 2024 (tableaux I|1|3, I|1|20, I|1|35, I|2|15 et I|4|9) ; calculs de l’auteur.Figure de James Wabenga Yango. Source : Banque centrale du Congo, Rapport annuel 2024 (tableaux I|1|3, I|1|20, I|1|35, I|2|15 et I|4|9) ; calculs de l’auteur.How to citeComment citer
Revenue excl. grants, % of GDPRecettes hors dons, % du PIB
Grants, % of GDPDons, % du PIB
Expenditure, % of GDPDépenses, % du PIB
Capital share of expenditure, %Part des dépenses en capital, %
Balance excl. grants, % of GDPSolde hors dons, % du PIB
Statistical adjustment, % of GDPAjustement statistique, % du PIB
Overall balance, % of GDPSolde global, % du PIB
Non-monetary financing, % of GDPFinancement non monétaire, % du PIB
2015
12.612,6
3.73,7
16.816,8
29.629,6
-4.2-4,2
-0.2-0,2
-0.7-0,7
0.00,0
2016
9.89,8
3.53,5
14.414,4
30.530,5
-4.6-4,6
-0.1-0,1
-1.3-1,3
0.00,0
2017
9.69,6
3.93,9
13.513,5
39.839,8
-3.9-3,9
-0.0-0,0
-0.0-0,0
0.00,0
2018
10.310,3
2.32,3
12.812,8
30.030,0
-2.5-2,5
0.20,2
-0.0-0,0
0.00,0
2019
8.68,6
8.38,3
17.717,7
25.825,8
-9.1-9,1
-0.3-0,3
-1.0-1,0
0.10,1
2020
9.69,6
5.55,5
14.214,2
33.933,9
-4.6-4,6
-1.5-1,5
-0.6-0,6
0.60,6
2021
12.612,6
4.24,2
15.015,0
29.929,9
-2.4-2,4
-1.2-1,2
0.50,5
0.20,2
2022
14.014,0
5.05,0
18.618,6
28.028,0
-4.6-4,6
-0.7-0,7
-0.2-0,2
0.10,1
2023
12.712,7
3.53,5
14.714,7
32.132,1
-2.0-2,0
-2.3-2,3
-0.9-0,9
0.30,3
2024
13.813,8
3.13,1
19.619,6
34.034,0
-5.8-5,8
2.52,5
-0.3-0,3
0.80,8
Rebuilt from the integrated operations of the general government (table I|2|15 of the annual report). Every identity is checked: revenue plus grants equals total revenue, current plus capital spending equals total expenditure, and financing equals minus the overall balance. The overall balance, as the central bank defines it, is the balance plus the statistical adjustment less the surplus of the social security funds. The headline is therefore misleading in two ways. Grants appear on both sides, as revenue and as the donor-financed spending they pay for, so that they cancel; without them the deficit was 5.8 per cent of output in 2024, not 0.3. And the statistical adjustment, which is the unexplained gap between the two sources, is larger than the overall balance itself: minus 2.3 per cent of output in 2023 and plus 2.5 in 2024. The percentages use the central bank’s own nominal GDP, which is 8 per cent lower than the Fund’s figure for 2024. The Fund’s table of public finances elsewhere on this page counts expenditure at 16.4 per cent of output in 2024 against 19.6 here; the difference, 3.2 points, is close to the 3.1 points of donor-financed spending that the central bank counts, so the two tables do not measure the same perimeter. Before 2019 the central bank reports no non-monetary financing; the dash in its table is shown here as zero.Reconstitué à partir de la situation intégrée des opérations des administrations publiques (tableau I|2|15 du rapport annuel). Chaque identité est vérifiée : recettes plus dons égalent recettes totales, dépenses courantes plus dépenses en capital égalent dépenses totales, et le financement égale l’opposé du solde global. Le solde global, tel que la banque centrale le définit, est le solde plus l’ajustement statistique moins l’excédent des caisses de sécurité sociale. Le chiffre d’appel trompe donc de deux façons. Les dons figurent des deux côtés, en recettes et en dépenses financées par les bailleurs, de sorte qu’ils s’annulent ; sans eux le déficit était de 5,8 pour cent de la production en 2024, non de 0,3. Et l’ajustement statistique, l’écart inexpliqué entre les deux sources, est plus grand que le solde global lui-même : moins 2,3 pour cent de la production en 2023 et plus 2,5 en 2024. Les pourcentages utilisent le PIB nominal de la banque centrale, inférieur de 8 pour cent à celui du Fonds en 2024. Le tableau des finances publiques du Fonds, ailleurs sur cette page, compte des dépenses de 16,4 pour cent de la production en 2024 contre 19,6 ici ; l’écart de 3,2 points est proche des 3,1 points de dépenses financées par les bailleurs que la banque centrale compte, de sorte que les deux tableaux ne mesurent pas le même périmètre. Avant 2019, la banque centrale ne déclare aucun financement non monétaire.
Source:Source : Banque centrale du Congo, Rapport annuel 2024 (tableaux I|1|3, I|1|20, I|1|35, I|2|15 et I|4|9) ; calculs de l’auteur.
Table compiled by James Wabenga Yango.Tableau composé par James Wabenga Yango.How to citeComment citer
Three measures of inflation, and what the central bank publishesTrois mesures de l’inflation, et ce que publie la banque centrale
Figure by James Wabenga Yango. Source: Banque centrale du Congo, Rapport annuel 2024 (tableaux I|1|3, I|1|20, I|1|35, I|2|15 et I|4|9) ; calculs de l’auteur. Indice des prix mensuel de l’auteur : série de l’Institut national de la statistique relayée par la banque centrale.Figure de James Wabenga Yango. Source : Banque centrale du Congo, Rapport annuel 2024 (tableaux I|1|3, I|1|20, I|1|35, I|2|15 et I|4|9) ; calculs de l’auteur. Indice des prix mensuel de l’auteur : série de l’Institut national de la statistique relayée par la banque centrale.How to citeComment citer
Figure by James Wabenga Yango. Source: Banque centrale du Congo, Rapport annuel 2024 (tableaux I|1|3, I|1|20, I|1|35, I|2|15 et I|4|9) ; calculs de l’auteur. Indice des prix mensuel de l’auteur : série de l’Institut national de la statistique relayée par la banque centrale.Figure de James Wabenga Yango. Source : Banque centrale du Congo, Rapport annuel 2024 (tableaux I|1|3, I|1|20, I|1|35, I|2|15 et I|4|9) ; calculs de l’auteur. Indice des prix mensuel de l’auteur : série de l’Institut national de la statistique relayée par la banque centrale.How to citeComment citer
Consumer prices, annual average, %Prix à la consommation, moyenne annuelle, %
Consumer prices, December on December, %Prix à la consommation, décembre sur décembre, %
GDP deflator, %Déflateur du PIB, %
Deflator minus consumer prices, pointsDéflateur moins prix à la consommation, points
Copper price, annual average change, %Cuivre, variation de la moyenne annuelle, %
Published by the central bank, average, %Publié par la banque centrale, moyenne, %
Published by the central bank, December on December, %Publié par la banque centrale, décembre sur décembre, %
2015
0.70,7
0.80,8
-1.2-1,2
-1.9-1,9
-19.7-19,7
—
—
2016
3.23,2
11.211,2
4.34,3
1.11,1
-11.7-11,7
—
—
2017
35.735,7
54.754,7
43.143,1
7.47,4
26.726,7
—
—
2018
29.329,3
7.27,2
31.031,0
1.71,7
5.85,8
—
—
2019
4.74,7
4.64,6
5.95,9
1.21,2
-8.0-8,0
4.84,8
4.64,6
2020
11.411,4
15.815,8
3.93,9
-7.5-7,5
2.72,7
11.011,0
15.815,8
2021
9.09,0
5.35,3
15.015,0
6.06,0
50.950,9
9.49,4
5.35,3
2022
9.39,3
13.113,1
10.110,1
0.80,8
-5.2-5,2
9.19,1
13.113,1
2023
19.919,9
23.823,8
14.214,2
-5.7-5,7
-3.8-3,8
19.519,5
23.823,8
2024
17.717,7
11.711,7
14.314,3
-3.4-3,4
7.77,7
18.218,2
11.711,7
The first two columns are computed from the monthly consumer price index (December 2011 = 100); the third divides the central bank’s nominal GDP by its GDP at 2005 prices and takes the yearly change, and it reproduces the deflator variation the central bank prints, to the decimal, in every year from 2006 to 2024. December on December agrees with the central bank’s published cumulative figure in all six years it prints. The annual average does not: my averages differ from the printed ones by between 0.1 and 0.5 point (17.7 against 18.2 in 2024). Neither a ratio of yearly averages nor an average of twelve yearly changes reproduces the printed figure, and the statistical institute compiles a weekly index, so the likely cause is that the central bank averages weekly readings where I average monthly ones; I could not verify it. The average and the December figures differ by up to 22 points (2018: 29.3 against 7.2) because they answer different questions: the average compares the price level of two years, the December figure the speed of prices over the last twelve months. The deflator follows the average and not the December figure, as it should, since GDP is a flow measured at average prices. It departs from consumer prices for a different reason: it prices all output, including copper and cobalt exports, whereas the consumer basket is 70 per cent food. In the nine years 2016 to 2024 the gap between the two correlates at 0.57 with the change in the copper price and at 0.22 with the depreciation of the franc. With nine observations that is suggestive and nothing more.Les deux premières colonnes sont calculées sur l’indice mensuel des prix à la consommation (décembre 2011 = 100) ; la troisième divise le PIB nominal de la banque centrale par son PIB aux prix de 2005 et en prend la variation annuelle : elle reproduit au dixième près la variation du déflateur imprimée par la banque centrale, chaque année de 2006 à 2024. Décembre sur décembre concorde avec le cumul publié par la banque centrale les six années où elle l’imprime. La moyenne annuelle ne concorde pas : mes moyennes diffèrent des chiffres imprimés de 0,1 à 0,5 point (17,7 contre 18,2 en 2024). Ni le rapport des moyennes annuelles ni la moyenne de douze glissements ne retrouve le chiffre imprimé, et l’Institut national de la statistique compile un indice hebdomadaire : la cause probable est que la banque centrale moyenne des relevés hebdomadaires là où je moyenne des relevés mensuels ; je n’ai pas pu le vérifier. La moyenne et le chiffre de décembre diffèrent jusqu’à 22 points (2018 : 29,3 contre 7,2) parce qu’ils répondent à deux questions : la moyenne compare le niveau des prix de deux années, le chiffre de décembre la vitesse des prix sur les douze derniers mois. Le déflateur suit la moyenne et non décembre, ce qui est normal puisque le PIB est un flux mesuré aux prix moyens. Il s’écarte des prix à la consommation pour une autre raison : il prend en compte toute la production, cuivre et cobalt exportés compris, alors que le panier de consommation compte 70 pour cent d’alimentation. Sur les neuf années 2016 à 2024, l’écart entre les deux est corrélé à 0,57 avec la variation du prix du cuivre et à 0,22 avec la dépréciation du franc. Avec neuf observations, c’est un indice et rien de plus.
Source:Source : Banque centrale du Congo, Rapport annuel 2024 (tableaux I|1|3, I|1|20, I|1|35, I|2|15 et I|4|9) ; calculs de l’auteur. Indice des prix mensuel de l’auteur : série de l’Institut national de la statistique relayée par la banque centrale.
Table compiled by James Wabenga Yango.Tableau composé par James Wabenga Yango.How to citeComment citer
What drove prices in 2024: the twelve functions of the consumer basketCe qui a fait monter les prix en 2024 : les douze fonctions du panier de consommation
Figure by James Wabenga Yango. Source: Banque centrale du Congo, Rapport annuel 2024 (tableaux I|1|3, I|1|20, I|1|35, I|2|15 et I|4|9) ; calculs de l’auteur.Figure de James Wabenga Yango. Source : Banque centrale du Congo, Rapport annuel 2024 (tableaux I|1|3, I|1|20, I|1|35, I|2|15 et I|4|9) ; calculs de l’auteur.How to citeComment citer
Contribution to inflation, pointsContribution à l’inflation, points
Food and non-alcoholic beveragesProduits alimentaires et boissons non alcoolisées
70.0270,02
380.4380,4
421.0421,0
10.710,7
6.846,84
Alcohol, tobacco and narcoticsBoissons alcoolisées, tabacs et stupéfiants
2.162,16
253.4253,4
269.1269,1
6.26,2
0.080,08
Clothing and footwearArticles d’habillement et chaussures
4.534,53
425.9425,9
468.4468,4
10.010,0
0.460,46
Housing, water, gas, electricity and other fuelsLogement, eau, gaz, électricité et autres combustibles
3.803,80
977.5977,5
1,113.71 113,7
13.913,9
1.241,24
Furnishings, household equipment and routine upkeepMeubles, articles de ménage et entretien courant du foyer
3.613,61
348.4348,4
390.6390,6
12.112,1
0.370,37
HealthSanté
1.961,96
521.1521,1
577.3577,3
10.810,8
0.270,27
TransportTransports
4.424,42
386.0386,0
473.4473,4
22.722,7
0.930,93
CommunicationsCommunications
0.480,48
314.2314,2
335.9335,9
6.96,9
0.030,03
Recreation and cultureLoisir et culture
2.182,18
340.5340,5
382.4382,4
12.312,3
0.220,22
EducationEnseignement
1.031,03
415.1415,1
439.4439,4
5.85,8
0.060,06
Restaurants and hotelsRestaurants et hôtels
1.491,49
645.0645,0
782.1782,1
21.321,3
0.490,49
Miscellaneous goods and servicesBiens et services divers
4.324,32
575.5575,5
642.6642,6
11.711,7
0.700,70
Recomputed from the twelve sub-indices and the fixed weights the central bank prints. The weighted sum of the sub-indices gives a general index of 415.78 in December 2023 and 464.38 in December 2024, against 415.77 and 464.36 printed, and an inflation of 11.69 per cent, the printed figure to the hundredth; the contributions I recompute match the printed ones to the hundredth, except housing, which I get as 1.24 points against 1.25. Food alone contributes 6.84 of the 11.69 points because it weighs 70 per cent. Housing, water and electricity rose almost 14 per cent and contributes 1.25 points on a weight of 3.8 per cent. The weights are those of the December 2011 base and have not been revised in fifteen years. I found no index published by province, in the central bank’s report or in the other sources I could read: the index covers the country as a whole, so an inflation rate by province cannot be built from published data.Recalculé à partir des douze sous-indices et des pondérations fixes que la banque centrale imprime. La somme pondérée des sous-indices donne un indice général de 415,78 en décembre 2023 et de 464,38 en décembre 2024, contre 415,77 et 464,36 imprimés, et une inflation de 11,69 pour cent, le chiffre imprimé au centième ; les contributions que je recalcule coïncident avec les contributions imprimées au centième près, sauf le logement, que je trouve à 1,24 point contre 1,25. L’alimentation seule apporte 6,84 des 11,69 points parce qu’elle pèse 70 pour cent. Le logement, l’eau et l’électricité ont monté de presque 14 pour cent et apportent 1,25 point pour un poids de 3,8 pour cent. Les pondérations sont celles du panier de décembre 2011 et n’ont pas été révisées depuis quinze ans. Je n’ai trouvé aucun indice publié par province, ni dans le rapport de la banque centrale ni dans les autres sources que j’ai pu lire : l’indice couvre le pays entier, de sorte qu’un taux d’inflation par province ne peut pas être construit à partir de données publiées.
Source:Source : Banque centrale du Congo, Rapport annuel 2024 (tableaux I|1|3, I|1|20, I|1|35, I|2|15 et I|4|9) ; calculs de l’auteur.
Table compiled by James Wabenga Yango.Tableau composé par James Wabenga Yango.How to citeComment citer
Three measures of GDP: current prices, 2005 prices, and chained 2024 francsTrois mesures du PIB : prix courants, prix de 2005 et francs de 2024 enchaînés
Figure by James Wabenga Yango. Source: Banque centrale du Congo, Rapport annuel 2024 (tableaux I|1|3, I|1|20, I|1|35, I|2|15 et I|4|9) ; calculs de l’auteur.Figure de James Wabenga Yango. Source : Banque centrale du Congo, Rapport annuel 2024 (tableaux I|1|3, I|1|20, I|1|35, I|2|15 et I|4|9) ; calculs de l’auteur.How to citeComment citer
Nominal and 2005-price GDP are the central bank's annual series (Annual Report 2024). The chained series applies the real growth rates, year by year, backwards from 2024 current francs, so that it equals nominal GDP in 2024 and measures every earlier year in 2024 prices. Because the central bank publishes only the aggregate, not the expenditure or sector components, this is a chain-linked volume index on the aggregate and not a Fisher or Törnqvist chain-weighted aggregate; it differs from rebasing the 2005-price series only if the published growth rates differ from the implied ones, and they do not (the two agree to the decimal for 2006-2024). The gap between the nominal and the real line is the price level: the deflator rose elevenfold since 2005, so nominal GDP overstates growth in output. The bcc.cd page for 2025-2026 gives real GDP of 18,504 and 19,561 billion francs at 2005 prices, which implies growth of 7.2 per cent in 2025 against the 5.7 per cent printed; I did not extend the series until the two are reconciled. The IMF-based nominal GDP in the national-accounts table (216,585 billion in 2024) also differs from the central bank's 199,717 billion.Les PIB nominal et aux prix de 2005 sont les séries annuelles de la banque centrale (Rapport annuel 2024). La série enchaînée applique les taux de croissance réels, année après année, en remontant depuis les francs courants de 2024 ; elle égale donc le PIB nominal en 2024 et mesure chaque année antérieure en prix de 2024. La banque centrale ne publie que l'agrégat, non les composantes par dépense ou par secteur : il s'agit d'un indice de volume enchaîné sur l'agrégat et non d'un agrégat à pondérations enchaînées de type Fisher ou Törnqvist. Il ne diffère d'un simple changement de base de la série aux prix de 2005 que si les taux de croissance publiés s'écartent des taux implicites, ce qui n'est pas le cas (les deux concordent à la décimale de 2006 à 2024). L'écart entre les courbes nominale et réelle est le niveau des prix : le déflateur a été multiplié par plus de onze depuis 2005, de sorte que le PIB nominal surestime la croissance de la production. La page bcc.cd donne pour 2025 et 2026 un PIB réel de 18 504 et 19 561 milliards de francs aux prix de 2005, ce qui implique une croissance de 7,2 pour cent en 2025 contre 5,7 pour cent imprimés ; je n'ai pas prolongé la série avant que l'écart soit expliqué. Le PIB nominal du tableau des comptes nationaux (216 585 milliards en 2024, source FMI) diffère aussi de celui de la banque centrale (199 717 milliards).
Source:Source : Banque centrale du Congo, Rapport annuel 2024 (tableaux I|1|3, I|1|20, I|1|35, I|2|15 et I|4|9) ; calculs de l’auteur.
Table compiled by James Wabenga Yango.Tableau composé par James Wabenga Yango.How to citeComment citer
The money multiplier of the DR Congo: currency drain, reserve ratio and velocityLe multiplicateur monétaire de la RD Congo : drainage en numéraire, coefficient de réserve et vitesse
Figure by James Wabenga Yango. Source: Banque centrale du Congo, Rapport annuel 2024 (tableaux I|1|3, I|1|20, I|1|35, I|2|15 et I|4|9) ; calculs de l’auteur.Figure de James Wabenga Yango. Source : Banque centrale du Congo, Rapport annuel 2024 (tableaux I|1|3, I|1|20, I|1|35, I|2|15 et I|4|9) ; calculs de l’auteur.How to citeComment citer
Figure by James Wabenga Yango. Source: Banque centrale du Congo, Rapport annuel 2024 (tableaux I|1|3, I|1|20, I|1|35, I|2|15 et I|4|9) ; calculs de l’auteur.Figure de James Wabenga Yango. Source : Banque centrale du Congo, Rapport annuel 2024 (tableaux I|1|3, I|1|20, I|1|35, I|2|15 et I|4|9) ; calculs de l’auteur.How to citeComment citer
Method of the course notes: with currency held by the public N = aD and bank reserves R = bD, broad money is M = D + N and the monetary base BM = N + R, so M/BM = (1 + a)/(a + b). Here N is the currency outside banks, D is M minus N (transferable and other deposits, in francs and in foreign currency), and R is BM minus N. The identity holds to the decimal in all ten years. The multiplier moved between 3,18 and 5,00, and the two behavioural coefficients explain it: the currency drain fell from 0,234 to 0,125 as deposits grew, which raises the multiplier, while the reserve ratio moved in a band of 0,089 to 0,176 which may reflect changes in the reserve requirement (a rise in b lowers the multiplier, as in 2019 and 2022). The 2020 peak of 5.00 combines the lowest reserve ratio with a fall in the drain. Two cautions for reading it. First, broad money includes deposits in foreign currency, which are in large part dollarised deposits, so the multiplier measures the whole financial system and not the creation of francs; a depreciation raises M in francs without any central bank action. Second, a multiplier is a ratio of stocks, not a causal coefficient: the base is the central bank's liability, but its growth was driven by financing the state and by foreign exchange purchases, and the multiplier amplifies it without commanding it. Velocity, the last column, fell from 8,5 to 4,3: monetisation, dollarisation and the spread of deposits mean a franc of broad money supports half the transactions it supported in 2015.Méthode des notes de cours : si le public détient du numéraire N = aD et les banques des réserves R = bD, la monnaie au sens large est M = D + N et la base monétaire BM = N + R, d'où M/BM = (1 + a)/(a + b). Ici N est le numéraire hors banques, D vaut M moins N (dépôts transférables et autres dépôts, en francs et en devises) et R vaut BM moins N. L'identité tient à la décimale pour les dix années. Le multiplicateur a oscillé entre 3,18 et 5,00, et les deux coefficients de comportement l'expliquent : le drainage en numéraire est passé de 0,234 à 0,125 à mesure que les dépôts augmentaient, ce qui relève le multiplicateur, tandis que le coefficient de réserve a évolué entre 0,089 et 0,176 ce qui peut refléter des changements du coefficient de réserves obligatoires (une hausse de b abaisse le multiplicateur, comme en 2019 et 2022). Le sommet de 2020, à 5,00, combine le coefficient de réserve le plus bas et une baisse du drainage. Deux précautions de lecture. D'abord, la monnaie au sens large inclut les dépôts en devises, en grande partie dollarisés : le multiplicateur mesure le système financier entier et non la création de francs ; une dépréciation relève M en francs sans aucune action de la banque centrale. Ensuite, un multiplicateur est un rapport de stocks et non un coefficient causal : la base est un passif de la banque centrale, mais sa croissance a été portée par le financement de l'État et les achats de devises, et le multiplicateur l'amplifie sans la commander. La vitesse, dernière colonne, est passée de 8,5 à 4,3 : monétisation, dollarisation et diffusion des dépôts font qu'un franc de monnaie large soutient la moitié des transactions qu'il soutenait en 2015.
Source:Source : Banque centrale du Congo, Rapport annuel 2024 (tableaux I|1|3, I|1|20, I|1|35, I|2|15 et I|4|9) ; calculs de l’auteur.
Table compiled by James Wabenga Yango.Tableau composé par James Wabenga Yango.How to citeComment citer
The quantity equation, year by year: money, velocity, output and the deflatorL'équation d'échange, année par année : monnaie, vitesse, production et déflateur
Figure by James Wabenga Yango. Source: Banque centrale du Congo, Rapport annuel 2024 (tableaux I|1|3, I|1|20, I|1|35, I|2|15 et I|4|9) ; calculs de l’auteur.Figure de James Wabenga Yango. Source : Banque centrale du Congo, Rapport annuel 2024 (tableaux I|1|3, I|1|20, I|1|35, I|2|15 et I|4|9) ; calculs de l’auteur.How to citeComment citer
Broad money growth, %Croissance de la monnaie large, %
Velocity change, %Variation de la vitesse, %
Real GDP growth, %Croissance du PIB réel, %
GDP deflator inflation, %Inflation du déflateur du PIB, %
Excess money (money minus output growth), pointsExcès de monnaie (monnaie moins production), points
Monetary base growth, %Croissance de la base monétaire, %
2016
23.023,0
-13.1-13,1
2.42,4
4.34,3
20.620,6
27.927,9
2017
42.742,7
4.04,0
3.73,7
43.143,1
39.039,0
21.321,3
2018
27.027,0
9.19,1
5.85,8
31.031,0
21.221,2
27.227,2
2019
35.935,9
-18.7-18,7
4.44,4
5.95,9
31.531,5
43.243,2
2020
45.945,9
-27.6-27,6
1.71,7
3.93,9
44.244,2
3.63,6
2021
36.736,7
-10.7-10,7
6.26,2
15.015,0
30.530,5
47.447,4
2022
3.53,5
15.915,9
8.98,9
10.110,1
-5.4-5,4
38.338,3
2023
40.340,3
-11.6-11,6
8.68,6
14.214,2
31.731,7
19.419,4
2024
28.128,1
-4.8-4,8
6.76,7
14.314,3
21.421,4
18.518,5
From MV = PY, growth rates give (1 + inflation) = (1 + money growth)(1 + velocity change)/(1 + output growth); the columns satisfy this identity to the decimal for the deflator, so it is an accounting statement and not a test. The theory predicts that inflation tracks money growth minus output growth when velocity is stable. Here it is not: velocity moved by between -27,6 and 15,9 per cent a year, and the correlation of excess money with deflator inflation is only 0,16 the same year and 0,02 with a one-year lead (nine observations, so neither is significant). The lead of the base is -0,28. The reading is that, over a decade, the proportionality of the quantity theory holds as a long-run statement (money grew about 32 per cent a year on average against a deflator of about 16 and output of about 5, the gap being the fall in velocity), but it is a poor year-to-year predictor in a dollarised economy: broad money in francs rises when the franc depreciates because foreign-currency deposits are revalued, so it is partly an effect of prices, not only a cause.De MV = PY, les taux de croissance donnent (1 + inflation) = (1 + croissance de la monnaie)(1 + variation de la vitesse)/(1 + croissance de la production) ; les colonnes satisfont cette identité à la décimale pour le déflateur : c'est un énoncé comptable et non un test. La théorie prédit que l'inflation suit la croissance de la monnaie moins celle de la production quand la vitesse est stable. Ce n'est pas le cas : la vitesse a varié entre -27,6 et 15,9 pour cent par an, et la corrélation de l'excès de monnaie avec l'inflation du déflateur n'est que de 0,16 la même année et de 0,02 avec une avance d'un an (neuf observations, donc aucune n'est significative). L'avance de la base est de -0,28. La lecture est que, sur une décennie, la proportionnalité de la théorie quantitative tient comme énoncé de long terme (la monnaie a crû d'environ 32 pour cent par an en moyenne contre un déflateur d'environ 16 et une production d'environ 5, l'écart étant la baisse de la vitesse), mais qu'elle prédit mal d'une année à l'autre dans une économie dollarisée : la monnaie large en francs monte quand le franc se déprécie parce que les dépôts en devises sont réévalués, de sorte qu'elle est en partie un effet des prix et pas seulement une cause.
Source:Source : Banque centrale du Congo, Rapport annuel 2024 (tableaux I|1|3, I|1|20, I|1|35, I|2|15 et I|4|9) ; calculs de l’auteur.
Table compiled by James Wabenga Yango.Tableau composé par James Wabenga Yango.How to citeComment citer
Household basket in Kinshasa, October 2025: retail prices before and after the announced cutPanier de la ménagère à Kinshasa, octobre 2025 : prix de détail avant et après la baisse annoncée
Figure by James Wabenga Yango. Source: Scoop RDC, « Kinshasa : baisse des prix jusqu'à 24 % sur les produits de base », 30 octobre 2025 (prix relevés dans les enseignes SOKIN, SOCIMEX et Maison NGOMA) ; calculs de l’auteur.Figure de James Wabenga Yango. Source : Scoop RDC, « Kinshasa : baisse des prix jusqu'à 24 % sur les produits de base », 30 octobre 2025 (prix relevés dans les enseignes SOKIN, SOCIMEX et Maison NGOMA) ; calculs de l’auteur.How to citeComment citer
Unweighted geometric mean (Jevons index)Moyenne géométrique simple (indice de Jevons)
—
—
—
-18.2-18,2
81.881,8
Cost of one unit of each SOKIN product, CDFCoût d'une unité de chaque produit SOKIN, CDF
—
434,700434 700
360,230360 230
-17.1-17,1
82.982,9
No official series of household-basket prices is published in a form I could retrieve: the central bank publishes the consumer price index (twelve functions, fixed 2011 weights, see the table above), and the ministry of the national economy communicates prices to the press without publishing a dated series. This table is therefore a one-time retail snapshot of nine staples, not a price index over time. The press report gives no date for the 'before' prices, and the figures are shelf prices in three chains, which can embed promotions. The unweighted geometric mean of the nine price relatives is -18.2 per cent. I did not apply the central bank's weights because the products are too few to map onto its twelve functions. Rows whose unit was not stated (a refined oil, a salt sachet, salted fish) are left out, and a January 2025 report of a 292,800 franc sack of sugar was not used because its pack size is not given.Aucune série officielle de prix du panier de la ménagère n'est publiée sous une forme que j'ai pu récupérer : la banque centrale publie l'indice des prix à la consommation (douze fonctions, pondérations fixes de 2011, voir le tableau ci-dessus), et le ministère de l'Économie nationale communique des prix à la presse sans publier de série datée. Ce tableau est donc un relevé de détail ponctuel de neuf produits de base, et non un indice dans le temps. L'article ne date pas les prix « avant », et ce sont des prix en rayon dans trois enseignes, qui peuvent inclure des promotions. La moyenne géométrique simple des neuf rapports de prix est de -18,2 pour cent. Je n'ai pas appliqué les pondérations de la banque centrale : les produits sont trop peu nombreux pour être rattachés à ses douze fonctions. Les lignes sans unité précisée (une huile raffinée, un sachet de sel, le poisson salé) sont écartées, de même qu'un sac de sucre à 292 800 francs rapporté en janvier 2025, dont le conditionnement n'est pas donné.
Source:Source : Scoop RDC, « Kinshasa : baisse des prix jusqu'à 24 % sur les produits de base », 30 octobre 2025 (prix relevés dans les enseignes SOKIN, SOCIMEX et Maison NGOMA) ; calculs de l’auteur.
Table compiled by James Wabenga Yango.Tableau composé par James Wabenga Yango.How to citeComment citer
Commodity price monitorSuivi des cours des matières premières
Mining accounts for 93.6 per cent of Congolese exports, so world commodity prices are not a sectoral variable in this economy: they are the terms of trade, the main determinant of the exchange rate, and through the exchange rate the main determinant of the price level. The panel below tracks the products the Democratic Republic of the Congo sells and the one it chiefly buys. Series that the World Bank publishes monthly are read from the Pink Sheet; cobalt, tantalite and lithium are not covered there and appear as dated observations from market reports, with the date shown against each point.
La mine représente 93,6 pour cent des exportations congolaises : les cours mondiaux ne sont donc pas une variable sectorielle dans cette économie, ce sont les termes de l’échange, le principal déterminant du taux de change et, par le taux de change, le principal déterminant du niveau des prix. Le tableau de bord ci-dessous suit les produits que la République démocratique du Congo vend et celui qu’elle achète surtout. Les séries que la Banque mondiale publie mensuellement sont lues dans la Pink Sheet ; le cobalt, la tantalite et le lithium n’y figurent pas et apparaissent sous forme d’observations datées tirées de la presse de marché, la date étant inscrite à côté de chaque point.
CopperCuivre
14,474 $/t14 474 $/t+45.5 % on 2025+45,5 % sur 2025
Cobalt hydroxideHydroxyde de cobalt
25.40 $/lb25,40 $/lb24 June 202624 juin 2026
GoldOr
4,319 $/oz4 319 $/oz+25.5 % on 2025+25,5 % sur 2025
TinÉtain
53,712 $/t53 712 $/t+57.7 % on 2025+57,7 % sur 2025
TantaliteTantalite
152 $/lb152 $/lb19 February 202619 février 2026
Brent crude, an importBrent, une importation
116.8 $/bbl116,8 $/bbl+69.2 % on 2025+69,2 % sur 2025
Copper, tin and zinc, index 2023 = 100, to September 2026Cuivre, étain et zinc, indice 2023 = 100, jusqu’en septembre 2026
Three metals, three markets, and only one of them decides the Congolese year. Copper is about three quarters of exports, so the slope of the blue curve is, with a lag of a few months, the slope of government revenue: the Fund finds a near perfect correlation between domestic revenue and the copper price. Tin has risen faster still, but it is a small line in the trade accounts. What the plate does not show is the quantity: a price index says nothing about the tonnes actually shipped, and the two have moved together since 2023, which is why the export figures rise faster than this curve.Trois métaux, trois marchés, et un seul décide de l’année congolaise. Le cuivre fait environ les trois quarts des exportations : la pente de sa courbe est donc, avec quelques mois de retard, celle des recettes de l’État, le Fonds monétaire relevant une corrélation quasi parfaite entre les recettes intérieures et le prix du cuivre. L’étain a monté plus vite encore, mais il ne pèse presque rien dans les comptes extérieurs. Ce que la planche ne montre pas, c’est le volume : un indice de prix ne dit rien des tonnes effectivement expédiées, et les deux ont progressé ensemble depuis 2023, ce qui explique que les exportations montent plus vite que cette courbe.
Cobalt: a price made by Congolese policy, February 2025 to September 2026Cobalt : un prix fait par la politique congolaise, février 2025 à septembre 2026
This is the one world market where a Congolese decision moves the price. The export ban of February 2025 and the quota regime that replaced it multiplied the hydroxide price by five, which is the proof that holding three quarters of a resource confers real market power. The exercise is dangerous all the same: a high price funds the search for substitutes, and the payable share of the metal price offered for Congolese hydroxide fell from about ninety to about seventy per cent between early August and early September 2026. Read the plate as a lesson in bargaining rather than as a price series.C’est le seul marché mondial où une décision congolaise déplace le prix. L’interdiction d’exporter de février 2025, puis le régime de quotas qui l’a remplacée, ont multiplié par cinq le prix de l’hydroxyde : preuve qu’un pays détenant les trois quarts d’une ressource dispose d’un pouvoir de marché réel. L’exercice reste dangereux : un prix élevé finance la recherche de substituts, et la part du prix du métal payée pour l’hydroxyde congolais est tombée d’environ quatre-vingt-dix à environ soixante-dix pour cent entre le début d’août et le début de septembre 2026. Cette planche se lit comme une leçon de négociation plutôt que comme une série de prix.
Gold and Brent crude, 2023 to September 2026Or et pétrole Brent, 2023 à septembre 2026
Put the two curves together and you have the terms of trade in one picture. Gold is now the second Congolese export, and its rise since 2023 has cushioned the country twice: once through the artisanal mining incomes of the east, once through the receipts of the refiners. Crude oil is an import, and fuels were 36 per cent of merchandise imports in 2023, so every dollar on the Brent barrel is taken out of the same balance that gold feeds. When the two move together, the external account is neutral; when they diverge, as in 2025, the gain is real and it is temporary.Mises côte à côte, les deux courbes donnent les termes de l’échange en une image. L’or est devenu la deuxième exportation congolaise et sa hausse depuis 2023 a amorti le choc deux fois : par les revenus de l’exploitation artisanale de l’Est, puis par les recettes des raffineurs. Le brut, lui, est une importation, et les combustibles faisaient 36 pour cent des importations de marchandises en 2023 : chaque dollar sur le baril est donc retiré du solde que l’or alimente. Quand les deux courbes montent ensemble, le compte extérieur est neutre ; quand elles divergent, comme en 2025, le gain est réel et il est provisoire.
Agricultural export prices, index 2023 = 100Prix des exportations agricoles, indice 2023 = 100
These prices matter for what the country does not yet sell. The DRC has the land, the water and the climate for cocoa, coffee, palm oil and timber, and it exports almost none of them: agriculture occupies six workers in ten and provides under two per cent of export earnings. The plate is therefore a measure of foregone income rather than of received income. The cocoa curve carries a second lesson, on volatility: a price that triples in two years and falls by a third in one is not a basis for a farm plan, which is the whole argument for the storage, credit and price information that the country lacks.Ces prix comptent pour ce que le pays ne vend pas encore. La RD Congo a la terre, l’eau et le climat du cacao, du café, de l’huile de palme et du bois, et elle n’en exporte presque rien : l’agriculture occupe six travailleurs sur dix et fournit moins de deux pour cent des recettes d’exportation. La planche mesure donc un revenu manqué plutôt qu’un revenu reçu. La courbe du cacao porte une seconde leçon, sur la volatilité : un prix qui triple en deux ans et perd un tiers en un an ne fonde pas un plan d’exploitation, et c’est tout l’argument en faveur du stockage, du crédit et de l’information sur les prix, qui manquent au pays.
Tantalite and lithium carbonate, 2025 to mid-2026Tantalite et carbonate de lithium, 2025 à mi-2026
Two markets that the statistical system does not reach. Tantalite is mined in the eastern provinces, often by hand and often outside any register, which is why its price is known from press reports and not from an index. Lithium is not yet produced at scale in the country. Both lines should be read as orders of magnitude, and the gap between them and the Pink Sheet series is itself the finding: the minerals that matter most for the incomes of the east are the ones we measure worst.Deux marchés que l’appareil statistique n’atteint pas. La tantalite est extraite dans les provinces de l’Est, souvent à la main et souvent hors de tout registre : son prix se connaît par la presse et non par un indice. Le lithium n’est pas encore produit à l’échelle dans le pays. Les deux lignes se lisent comme des ordres de grandeur, et l’écart avec les séries de la Pink Sheet est lui-même le résultat : les minéraux qui comptent le plus pour les revenus de l’Est sont ceux que l’on mesure le plus mal.
World Bank price indices, metals and precious metalsIndices de prix de la Banque mondiale, métaux et métaux précieux
One curve for the whole external position. The metals and minerals index aggregates what the country sells; the precious metals index mostly tracks gold, which rises when the world is anxious. Their divergence since 2024 is informative: the first follows industrial demand, the second follows fear, and the DRC now earns from both. An economy whose terms of trade are summarised by one index is an economy whose budget can be forecast by one price, which is the definition of the problem rather than a convenience.Une courbe pour toute la position extérieure. L’indice des métaux et minéraux agrège ce que le pays vend ; celui des métaux précieux suit pour l’essentiel l’or, qui monte quand le monde s’inquiète. Leur divergence depuis 2024 est instructive : le premier suit la demande industrielle, le second suit la peur, et la RD Congo gagne désormais sur les deux. Une économie dont les termes de l’échange se résument à un indice est une économie dont le budget se prévoit avec un prix : c’est l’énoncé du problème, non une commodité.
Price monitor, latest readingTableau de bord, dernier point
The table gathers the fifteen prices that matter for the Congolese external accounts. The change column compares the latest reading with the 2025 annual average, which is the reference year of the current budget framework. Rough diamond has no freely published index and is left blank rather than estimated.
Le tableau rassemble les quinze prix qui comptent pour les comptes extérieurs congolais. La colonne de variation compare le dernier point à la moyenne annuelle de 2025, année de référence du cadrage budgétaire en vigueur. Le diamant brut ne dispose d’aucun indice publié en accès libre : la ligne est laissée vide plutôt qu’estimée.
CommodityProduit
UnitUnité
2025 averageMoyenne 2025
LatestDernier
Change, %Variation, %
As atAu
CopperCuivre
$/tonne$/tonne
9,9479 947
14,47414 474
+45.5+45,5
Sep 2026sept. 2026
Cobalt hydroxideHydroxyde de cobalt
$/lb$/lb
—
25.4025,40
—
24 Jun 202624 juin 2026
Cobalt metal, RotterdamCobalt métal, Rotterdam
$/lb$/lb
—
25.5325,53
—
4 Sep 20264 sept. 2026
GoldOr
$/troy ounce$/once troy
3,4423 442
4,3194 319
+25.5+25,5
Sep 2026sept. 2026
TinÉtain
$/tonne$/tonne
34,05934 059
53,71253 712
+57.7+57,7
Sep 2026sept. 2026
Tantalite (coltan)Tantalite (coltan)
$/lb$/lb
—
152.50152,50
—
19 Feb 202619 févr. 2026
ZincZinc
$/tonne$/tonne
2,8682 868
4,0214 021
+40.2+40,2
Sep 2026sept. 2026
Lithium carbonateCarbonate de lithium
$/kg$/kg
—
24.2024,20
—
Jun 2026juin 2026
Crude oil, BrentPétrole brut, Brent
$/barrel$/baril
69.069,0
116.8116,8
+69.2+69,2
Sep 2026sept. 2026
Rough diamondDiamant brut
indexindice
—
—
—
——
CocoaCacao
$/kg$/kg
7.807,80
5.925,92
−24.1−24,1
Sep 2026sept. 2026
Coffee, arabicaCafé arabica
$/kg$/kg
8.478,47
7.267,26
−14.3−14,3
Sep 2026sept. 2026
Coffee, robustaCafé robusta
$/kg$/kg
4.864,86
3.693,69
−24.1−24,1
Sep 2026sept. 2026
Palm oilHuile de palme
$/tonne$/tonne
1,0071 007
1,1801 180
+17.2+17,2
Sep 2026sept. 2026
Rubber, TSR20Caoutchouc, TSR20
$/kg$/kg
1.771,77
2.412,41
+36.2+36,2
Sep 2026sept. 2026
Logs, AfricaGrumes, Afrique
$/cubic metre$/mètre cube
395.4395,4
402.9402,9
+1.9+1,9
Sep 2026sept. 2026
Complete history, nothing truncated: 801 monthly observations, 267 quarterly observations, 66 annual observations. Rebuilt every night from the World Bank workbook.Historique complet, sans troncature : 801 observations mensuels, 267 observations trimestriels, 66 observations annuels. Reconstruit chaque nuit à partir du classeur de la Banque mondiale.
MonthlyMensuel
QuarterlyTrimestriel
AnnualAnnuel
Reading the price cycleLecture du cycle des prix
Three features of this cycle are unusual and each has a distinct policy implication. The first is that the metals boom is broad. Copper is up 36 per cent on its 2025 average, tin 56 per cent, zinc 25 per cent, and the World Bank metals and minerals index has moved from 112 to 141 on its 2010 base. This is not a copper-specific event that a single mine expansion could explain; it is a demand and inventory cycle in industrial metals as a class, and it will turn.
Trois traits de ce cycle sont inhabituels et chacun appelle une conclusion distincte pour la politique économique. Le premier est que la hausse des métaux est générale. Le cuivre progresse de 36 pour cent sur sa moyenne de 2025, l’étain de 56 pour cent, le zinc de 25 pour cent, et l’indice des métaux et minéraux de la Banque mondiale est passé de 112 à 141 sur sa base 2010. Il ne s’agit pas d’un événement propre au cuivre qu’une seule extension de mine expliquerait : c’est un cycle de demande et de stocks portant sur les métaux industriels comme classe, et il se retournera.
The second is that two of the four prices that matter most to the Congolese budget are now set, in part, in Kinshasa. Cobalt hydroxide had fallen to 5.60 dollars a pound when the export suspension of 22 February 2025 was announced; it stood at 25.40 dollars in June 2026 under the quota regime. That is a quadrupling produced by a supply decision rather than by demand, and it is the clearest recent demonstration that a country holding 73 per cent of world production has market power. Tantalite rose 43 per cent in seven weeks after the Rubaya landslide, for the opposite reason: an involuntary supply interruption in the east. The same mechanism, one voluntary and one not, tells the government what its share of world supply is worth, and warns it that a price obtained by restricting volume is a revenue gain only while the elasticity of substitution stays low.
Le deuxième est que deux des quatre prix qui comptent le plus pour le budget congolais se forment désormais, en partie, à Kinshasa. L’hydroxyde de cobalt était tombé à 5,60 dollars la livre lorsque la suspension des exportations du 22 février 2025 a été annoncée ; il valait 25,40 dollars en juin 2026 sous le régime de quotas. C’est un quadruplement produit par une décision d’offre et non par la demande, et c’est la démonstration récente la plus nette qu’un pays détenant 73 pour cent de la production mondiale dispose d’un pouvoir de marché. La tantalite a bondi de 43 pour cent en sept semaines après l’éboulement de Rubaya, pour la raison inverse : une interruption involontaire de l’offre dans l’est. Le même mécanisme, volontaire dans un cas et subi dans l’autre, indique au gouvernement ce que vaut sa part de l’offre mondiale, et l’avertit qu’un prix obtenu en restreignant les volumes n’est un gain de recettes que tant que l’élasticité de substitution reste faible.
The third is that the import side has turned against the country at the same time. Brent averaged 69 dollars in 2025 and 104 in the second quarter of 2026, a rise of more than a half at the peak. With an import dependence of 0.96 on refined fuels, that increase passes almost entirely into the Congolese price level. The favourable terms-of-trade shock on the export side is therefore substantially offset on the import side, which is why the current account improvement has been smaller than the copper price alone would suggest.
Le troisième est que le côté importations s’est retourné contre le pays au même moment. Le Brent a valu 69 dollars en moyenne en 2025 et 104 au deuxième trimestre de 2026, soit plus de la moitié de hausse au sommet. Avec une dépendance de 0,96 aux carburants raffinés importés, cette hausse se transmet presque intégralement au niveau des prix congolais. Le choc favorable des termes de l’échange du côté des exportations est donc largement compensé du côté des importations, ce qui explique que l’amélioration du solde courant ait été plus faible que le seul cours du cuivre ne le laisserait attendre.
The agricultural picture is the mirror image and deserves attention precisely because it is small in the accounts today. Cocoa has fallen back to 5.61 dollars a kilogram after a 2025 average of 7.80, and arabica coffee to 7.91 after 8.47, while palm oil, rubber and tropical logs have drifted up modestly. These are the products that reach household income directly, through food agriculture, which employs the greater part of the working population. A country whose export earnings rise and fall with three metals has an obvious interest in the one part of its export base that moves on a different cycle.
Le tableau agricole est l’image inverse, et il mérite attention précisément parce qu’il pèse peu dans les comptes d’aujourd’hui. Le cacao est retombé à 5,61 dollars le kilogramme après une moyenne de 7,80 en 2025, et le café arabica à 7,91 après 8,47, tandis que l’huile de palme, le caoutchouc et les grumes tropicales se sont modestement redressés. Ce sont les produits qui atteignent directement le revenu des ménages, par l’agriculture vivrière, qui occupe la plus grande part de la population active. Un pays dont les recettes d’exportation montent et descendent avec trois métaux a un intérêt évident pour la seule partie de sa base exportatrice qui suit un cycle différent.
Save the metals cycle, do not spend it.Épargner le cycle des métaux plutôt que le dépenser.
Copper at 13,543 dollars a tonne is thirty-six per cent above the price on which the 2025 budget was built. The entire difference is a windfall, not a permanent revenue base, and the network simulations put the cost of a twenty-five per cent reversal at 8.4 per cent of GDP. Appropriating the windfall to a stabilisation account and to reserve accumulation is the single highest-return use of it.Le cuivre à 13 543 dollars la tonne dépasse de trente-six pour cent le prix sur lequel le budget de 2025 a été bâti. La totalité de l’écart est une manne et non une assiette permanente, et les simulations de réseau chiffrent le coût d’un retournement de vingt-cinq pour cent à 8,4 pour cent du PIB. Affecter cette manne à un compte de stabilisation et à l’accumulation de réserves en est de loin l’usage le plus rentable.
Make the cobalt quota a rule, not a decision.Faire du quota cobalt une règle et non une décision.
The export restriction worked, but a discretionary quota invites both lobbying at home and substitution abroad. Publishing the quota formula, its review dates and the volume path to 2027 converts an administrative measure into a credible commitment, which is what raises the price that buyers are willing to plan around rather than hedge against.La restriction des exportations a fonctionné, mais un quota discrétionnaire appelle à la fois le lobbying intérieur et la substitution extérieure. Publier la formule du quota, ses dates de révision et la trajectoire de volumes jusqu’en 2027 transforme une mesure administrative en engagement crédible, ce qui est la condition pour que les acheteurs planifient sur ce prix au lieu de s’en couvrir.
Hedge the fuel bill rather than subsidise it.Couvrir la facture pétrolière plutôt que la subventionner.
Brent moved from 69 to 107 dollars in four quarters and imported fuel is 96 per cent of domestic supply. Price subsidies transfer that volatility to the budget at full cost; a modest rolling hedge on the imported volume, financed out of the mining windfall, caps the fiscal exposure at a known premium and leaves the domestic price signal intact.Le Brent est passé de 69 à 107 dollars en quatre trimestres et le carburant importé représente 96 pour cent de l’offre intérieure. Les subventions de prix transfèrent cette volatilité au budget à plein coût ; une couverture glissante modeste sur le volume importé, financée sur la manne minière, plafonne l’exposition budgétaire à une prime connue et laisse intact le signal-prix intérieur.
Capture the artisanal gold flow before taxing it more.Capter le flux d’or artisanal avant de l’imposer davantage.
Gold at 4,073 dollars an ounce is more than twice its 2023 level, and a large part of Congolese production leaves the country informally. Raising the traceable share, by opening buying centres and refining capacity and by offering a purchase price that competes with the smuggling route, yields more revenue at an unchanged rate than any increase in the rate itself.L’or à 4 073 dollars l’once vaut plus du double de son niveau de 2023, et une part importante de la production congolaise quitte le pays de façon informelle. Élever la part traçable, en ouvrant des comptoirs d’achat et une capacité de raffinage et en offrant un prix d’achat concurrentiel de la filière de contrebande, rapporte davantage à taux inchangé que n’importe quelle hausse du taux lui-même.
Use the boom to finance the agricultural export base.Utiliser la hausse des métaux pour financer la base exportatrice agricole.
Cocoa, coffee, palm oil, rubber and tropical logs move on a cycle unrelated to industrial metals, and they reach household income through the most connected branch of the network. Financing seed, extension services and rural roads out of mining revenue is the only diversification strategy that both raises growth and lowers macroeconomic volatility.Le cacao, le café, l’huile de palme, le caoutchouc et les grumes tropicales suivent un cycle sans rapport avec celui des métaux industriels, et ils atteignent le revenu des ménages par la branche la plus connectée du réseau. Financer les semences, la vulgarisation agricole et les routes de desserte sur les recettes minières est la seule stratégie de diversification qui élève à la fois la croissance et abaisse la volatilité macroéconomique.
Latest World Bank monthly reading: September 2026 · series refreshed automatically on 1 November 2026Dernière observation mensuelle de la Banque mondiale : septembre 2026 · séries actualisées automatiquement le 1 novembre 2026
Where output comes from and where work isD’où vient la production, où est le travail
A single question runs through the four tables below: which sector actually drives the Congolese economy? The answer is not read off the value-added shares, because the national accounts publish no separate line for the extractive industries. It is read off the growth table, where the Fund splits extractive from non-extractive output and the first grows at two to four times the rate of the second, and off the export table, where minerals make up more than ninety-eight per cent of goods sold abroad. The employment table then shows the other half of the picture: the sector that carries the exports employs about one worker in nine, while agriculture, which carries almost none of them, employs one in two. Infrastructure closes the section because it is the binding constraint both of them run into.
Une seule question traverse les quatre tableaux qui suivent : quel secteur entraîne réellement l’économie congolaise ? La réponse ne se lit pas dans les parts de valeur ajoutée, car les comptes nationaux ne publient aucune ligne distincte pour les industries extractives. Elle se lit dans le tableau de croissance, où le Fonds sépare la production extractive de la production non extractive et où la première croît deux à quatre fois plus vite que la seconde, et dans le tableau des exportations, où les minerais font plus de quatre-vingt-dix-huit pour cent des biens vendus à l’étranger. Le tableau de l’emploi montre alors l’autre moitié du tableau : le secteur qui porte les exportations occupe environ un travailleur sur neuf, tandis que l’agriculture, qui n’en porte presque aucune, en occupe un sur deux. Les infrastructures ferment la section parce qu’elles sont la contrainte que l’un et l’autre rencontrent.
Growth by sector: the extractive economy and the restCroissance par secteur : l’économie extractive et le reste
Figure by James Wabenga Yango. Source: IMF country report 26/2, table 1; USGS; ILO.Figure de James Wabenga Yango. Source : FMI, rapport pays 26/2, tableau 1 ; USGS ; OIT.How to citeComment citer
This is the table that names the key sector. Extractive activity grows three to six times faster than everything else, and the gap has been open every year since 2023. 2025 and 2026 are projections, not outturns. The Fund’s real GDP line reads 5.6 and 5.3 for those two years where the headline series on this page reads 5.7 and 5.9: the vintages differ, and neither figure is corrected here to agree with the other. The Bank’s three lines are real growth at factor prices and cover 2024 and 2025 only, which is why the first and last columns carry a dash.C’est le tableau qui nomme le secteur clé. L’activité extractive croît trois à six fois plus vite que tout le reste, et l’écart est ouvert chaque année depuis 2023. 2025 et 2026 sont des projections, non des réalisations. La ligne de PIB réel du Fonds donne 5,6 et 5,3 pour ces deux années là où la série principale de cette page donne 5,7 et 5,9 : les millésimes diffèrent, et aucun des deux chiffres n’est corrigé ici pour s’accorder à l’autre. Les trois lignes de la Banque sont des croissances réelles aux prix des facteurs et ne couvrent que 2024 et 2025, d’où le tiret dans la première et la dernière colonne.
Source:Source : FMI, République démocratique du Congo : deuxième revue des accords FEC et FRD, rapport pays nº 26/2, janvier 2026. Banque mondiale, Macro Poverty Outlook, édition d’avril 2026, fiche République démocratique du Congo ; seuils de pauvreté en parités de pouvoir d’achat de 2021.
Table compiled by James Wabenga Yango.Tableau composé par James Wabenga Yango.How to citeComment citer
Structure of value addedStructure de la valeur ajoutée
Figure by James Wabenga Yango. Source: Banque mondiale, World Development Indicators, tableau 4.2 « Structure of value added », consulté le 16 août 2026.Figure de James Wabenga Yango. Source : Banque mondiale, World Development Indicators, tableau 4.2 « Structure of value added », consulté le 16 août 2026.How to citeComment citer
2015, % of value added2015, % de la valeur ajoutée
2024, % of value added2024, % de la valeur ajoutée
Change, pointsÉcart, points
Agriculture, forestry and fishingAgriculture, sylviculture et pêche
12.512,5
9.69,6
-2.9-2,9
IndustryIndustrie
40.540,5
39.939,9
-0.6-0,6
of which manufacturingdont industrie manufacturière
16.816,8
8.28,2
-8.6-8,6
ServicesServices
42.442,4
46.646,6
4.24,2
The comparison year is 2015 because the World Bank table prints 2015 and 2024 and no 2010 column. Two readings matter here. Industry holds its share, but manufacturing inside it halves, from a sixth of value added to a twelfth: the industrial share is mining, and it is mining that has grown. Services take up the slack. The Bank does not publish a separate extractive-industries share of value added, so the key sector of the Congolese economy cannot be read directly off this table; it is read off the growth and export tables that follow, where the extractive figures are published in full. Nominal GDP went from 40.2 to 71.0 billion dollars over the same period.L’année de comparaison est 2015 parce que le tableau de la Banque mondiale imprime 2015 et 2024, sans colonne 2010. Deux lectures comptent ici. L’industrie tient sa part, mais la manufacture qu’elle contient est divisée par deux, d’un sixième à un douzième de la valeur ajoutée : la part industrielle, c’est la mine, et c’est la mine qui a crû. Les services prennent le reste. La Banque ne publie pas de part propre aux industries extractives dans la valeur ajoutée : le secteur clé de l’économie congolaise ne se lit donc pas directement sur ce tableau, mais sur ceux de la croissance et des exportations qui suivent, où les chiffres extractifs sont publiés en entier. Le PIB nominal est passé de 40,2 à 71,0 milliards de dollars sur la même période.
Source:Source : Banque mondiale, World Development Indicators, tableau 4.2 « Structure of value added », consulté le 16 août 2026.
Table compiled by James Wabenga Yango.Tableau composé par James Wabenga Yango.How to citeComment citer
Mining output and the extractive share of exportsProduction minière et part extractive des exportations
Figure by James Wabenga Yango. Source: United States Geological Survey, Mineral Commodity Summaries 2026, notices cuivre et cobalt, février 2026. FMI, République démocratique du Congo : deuxième revue des accords FEC et FRD, rapport pays nº 26/2, janvier 2026.Figure de James Wabenga Yango. Source : United States Geological Survey, Mineral Commodity Summaries 2026, notices cuivre et cobalt, février 2026. FMI, République démocratique du Congo : deuxième revue des accords FEC et FRD, rapport pays nº 26/2, janvier 2026.How to citeComment citer
Copper, mine production, thousand tonnesCuivre, production minière, milliers de tonnes
2,9902 990
3,2003 200
Copper, refinery production, thousand tonnesCuivre, production raffinée, milliers de tonnes
2,5602 560
2,8002 800
Cobalt, mine production, tonnesCobalt, production minière, tonnes
226,000226 000
230,000230 000
Goods exports, $mExportations de biens, millions USD
34,92734 927
36,40636 406
of which extractive, $mdont extractif, millions USD
34,35734 357
35,71735 717
The 2025 column is an estimate in the Survey and a projection in the Fund report; 2024 is an outturn for mining and preliminary for trade. Two proportions carry the whole argument of this page. The Survey puts Congolese cobalt at about seventy-three per cent of world mine output. The Fund’s trade table puts the extractive share of goods exports at 98.4 per cent in 2024 and 98.1 per cent in 2025. Reserves are large enough that neither figure is about to fall for geological reasons: eighty million tonnes of copper and six million tonnes of cobalt.La colonne 2025 est une estimation dans la publication du Survey et une projection dans le rapport du Fonds ; 2024 est une réalisation pour la mine et un chiffre provisoire pour le commerce. Deux proportions portent tout l’argument de cette page. Le Survey situe le cobalt congolais à environ soixante-treize pour cent de la production minière mondiale. Le tableau du commerce extérieur du Fonds situe la part extractive des exportations de biens à 98,4 pour cent en 2024 et à 98,1 pour cent en 2025. Les réserves sont assez larges pour qu’aucun de ces deux chiffres ne baisse pour des raisons géologiques : quatre-vingts millions de tonnes de cuivre et six millions de tonnes de cobalt.
Source:Source : United States Geological Survey, Mineral Commodity Summaries 2026, notices cuivre et cobalt, février 2026. FMI, République démocratique du Congo : deuxième revue des accords FEC et FRD, rapport pays nº 26/2, janvier 2026.
Table compiled by James Wabenga Yango.Tableau composé par James Wabenga Yango.How to citeComment citer
Employment by sector, modelled estimatesEmploi par secteur, estimations modélisées
Figure by James Wabenga Yango. Source: Organisation internationale du travail, estimations modélisées ILOEST, reprises par la Banque mondiale, World Development Indicators, tableaux 2.3 et 2.4.Figure de James Wabenga Yango. Source : Organisation internationale du travail, estimations modélisées ILOEST, reprises par la Banque mondiale, World Development Indicators, tableaux 2.3 et 2.4.How to citeComment citer
These are modelled estimates, not survey readings: the Labour Organization fits them where a labour force survey is missing, and the DRC is such a case. They are printed because nothing better exists, and they should be read as orders of magnitude. Note the contrast with the value added table above: mining is the key sector for output and for exports, industry as a whole employs about one man in nine and one woman in twenty. Vulnerable employment is own-account and contributing family work; it is the nearest published proxy for informality, which is not published as such for the DRC. The Bank publishes no combined figure for both sexes.Ce sont des estimations modélisées et non des relevés d’enquête : l’Organisation du travail les ajuste là où une enquête sur la population active manque, et la RD Congo est un tel cas. Elles figurent ici parce que rien de mieux n’existe et elles se lisent comme des ordres de grandeur. On notera le contraste avec le tableau de la valeur ajoutée : la mine est le secteur clé pour la production et pour les exportations, l’industrie tout entière emploie environ un homme sur neuf et une femme sur vingt. L’emploi vulnérable réunit les travailleurs à leur compte et les aides familiaux ; c’est le substitut publié le plus proche de l’informalité, qui n’est pas publiée comme telle pour la RD Congo. La Banque ne publie aucun chiffre réunissant les deux sexes.
Source:Source : Organisation internationale du travail, estimations modélisées ILOEST, reprises par la Banque mondiale, World Development Indicators, tableaux 2.3 et 2.4.
Table compiled by James Wabenga Yango.Tableau composé par James Wabenga Yango.How to citeComment citer
Infrastructure and accessInfrastructures et accès
IndicatorIndicateur
ValueValeur
YearAnnée
Access to electricity, % of populationAccès à l’électricité, % de la population
20,8
2021
Access to electricity, rural, % of populationAccès à l’électricité en milieu rural, % de la population
≈ 1
2022
Hydropower, % of electricity producedHydroélectricité, % de l’électricité produite
99,6
2015
Inga 1 and 2, installed capacity, MWInga 1 et 2, puissance installée, MW
1 775
2025
Total road network, kmRéseau routier total, km
152 400
2024
Paved share of the national road network, %Part revêtue du réseau routier national, %
2
2024
Individuals using the internet, %Personnes utilisant internet, %
18,0
2022
Population without basic drinking water, %Population sans eau de boisson de base, %
64
2024
Population without basic sanitation, %Population sans assainissement de base, %
84
2024
Population without basic hygiene, %Population sans hygiène de base, %
81
2024
The rural electricity figure is printed as an approximation because the source words it that way; it is not rounded here. The Inga line is the installed capacity of the two existing dams, against a site potential the Bank puts near forty-two thousand megawatts. Three quantities that a reader would reasonably expect are missing and are missing for the same reason: the national utility publishes no accessible report, so total installed generating capacity and actual Inga output do not appear; mobile penetration is no longer carried in the Bank table and the Telecommunication Union portal serves nothing a script can read; and the water and sanitation lines are basic service, not safely managed service, because the safely managed shares are not published for the DRC.Le chiffre rural de l’électricité est imprimé comme une approximation parce que la source le formule ainsi ; il n’est pas arrondi ici. La ligne Inga donne la puissance installée des deux barrages existants, contre un potentiel du site que la Banque situe près de quarante-deux mille mégawatts. Trois grandeurs qu’un lecteur attendrait manquent, et manquent pour la même raison : la société nationale d’électricité ne publie aucun rapport accessible, de sorte que la puissance installée totale et la production effective d’Inga ne figurent pas ; la pénétration mobile n’est plus portée par le tableau de la Banque et le portail de l’Union des télécommunications ne sert rien qu’un programme puisse lire ; et les lignes d’eau et d’assainissement portent sur le service de base et non sur le service géré en toute sécurité, dont les parts ne sont pas publiées pour la RD Congo.
Source:Source : Banque mondiale, World Development Indicators, tableaux 3.7 « Electricity production, sources, and access » et 5.11 « The information society », consultés le 16 août 2026. Banque mondiale, Inga 3 Development Program, Project Information Document, rapport nº PIDIA01263, 8 avril 2025. Banque mondiale, DRC Transport and Connectivity Support Project SOP 2, Project Information Document, rapport nº PIDDC00863, 6 août 2024. Banque mondiale, Scaling-Up Water Supply and Sanitation Access in Kinshasa, Project Information Document, rapport nº PIDDC01437, 18 décembre 2025, d’après OMS et UNICEF, Joint Monitoring Programme, édition 2025.
Table compiled by James Wabenga Yango.Tableau composé par James Wabenga Yango.How to citeComment citer
Population by territory and cityPopulation par territoire et par ville
The table lists 144 territories and 45 statutory cities and urban entities. The table below keeps every second-level entity: cities are not folded into the territory that surrounds them, because in the Democratic Republic of the Congo a city is a separate administrative level with its own budget and its own registers. Since no general census has been held since 1984, these figures are demographic projections rather than counts. I did not produce these projections: they come from the subnational population statistics published by OCHA and the Institut national de la statistique on the Humanitarian Data Exchange. The Methodology section of that dataset page describes where the figures come from: health-zone population statistics prepared by the DRC Information Management Working Group, summed to administrative units. This page only reorganises them.
Le tableau recense 144 territoires et 45 villes ou entités urbaines statutaires. Le tableau ci-dessous conserve chaque entité de niveau 2 : les villes ne sont pas fondues dans le territoire qui les entoure, car en République démocratique du Congo la ville constitue un échelon administratif distinct, doté de son propre budget et de ses propres registres. Aucun recensement général n’ayant été mené depuis 1984, ces effectifs sont des projections démographiques et non des dénombrements. Je n’ai pas produit ces projections : elles proviennent des statistiques de population infranationales publiées par OCHA et l’Institut national de la statistique sur l’Humanitarian Data Exchange. La section « Methodology » de cette fiche indique l’origine des chiffres : des statistiques de population par zone de santé, établies par le Groupe de travail sur la gestion de l’information de la RDC, additionnées par entité administrative. Cette page ne fait que les réorganiser.
Total populationPopulation totale
103,199,358103 199 358All 189 second-level entities, 2026 projection.Ensemble des 189 entités de niveau 2, projection 2026.
In territoriesDans les territoires
77,512,90477 512 90475.1 per cent of the total.75.1 % du total.
In citiesDans les villes
25,686,45425 686 45424.9 per cent of the total, spread over 20 cities with a population of their own.24.9 % du total, répartis sur 20 villes dotées d’une population propre.
Median territoryTerritoire médian
419,532419 532Mean 538,284; the distribution is skewed to the right.Moyenne : 538 284 ; la distribution est étirée vers la droite.
Largest territoryPlus grand territoire
2,572,9342 572 934Kamonia, Kasaï.Kamonia, Kasaï.
Smallest territoryPlus petit territoire
86,59686 596A ratio of 30 to 1 between the two extremes.Un rapport de 30 à 1 entre les deux extrêmes.
Population by province, 2026 projectionPopulation par province, projection 2026
Full table (189 entities)Tableau complet (189 entités)
EntityEntité
ProvinceProvince
TypeType
PopulationPopulation
Aketi
Bas-Uele
TerritoryTerritoire
221,726221 726
Ango
Bas-Uele
TerritoryTerritoire
111,815111 815
Bambesa
Bas-Uele
TerritoryTerritoire
134,346134 346
Bondo
Bas-Uele
TerritoryTerritoire
271,560271 560
Buta
Bas-Uele
TerritoryTerritoire
282,199282 199
Dingila
Bas-Uele
CityVille
—
Poko
Bas-Uele
TerritoryTerritoire
242,180242 180
Basankusu
Equateur
TerritoryTerritoire
400,786400 786
Bikoro
Equateur
TerritoryTerritoire
346,334346 334
Bolomba
Equateur
TerritoryTerritoire
483,380483 380
Bomongo
Equateur
TerritoryTerritoire
206,968206 968
Ingende
Equateur
TerritoryTerritoire
279,030279 030
Lukolela
Equateur
TerritoryTerritoire
192,738192 738
Makanza
Equateur
TerritoryTerritoire
131,634131 634
Mbandaka
Equateur
CityVille
408,266408 266
Kambove
Haut-Katanga
TerritoryTerritoire
1,007,6751 007 675
Kasenga
Haut-Katanga
TerritoryTerritoire
692,892692 892
Kipushi
Haut-Katanga
TerritoryTerritoire
335,416335 416
Likasi
Haut-Katanga
CityVille
159,613159 613
Lubumbashi
Haut-Katanga
CityVille
2,674,2882 674 288
Mitwaba
Haut-Katanga
TerritoryTerritoire
328,904328 904
Pweto
Haut-Katanga
TerritoryTerritoire
638,386638 386
Sakania
Haut-Katanga
TerritoryTerritoire
265,368265 368
Bukama
Haut-Lomami
TerritoryTerritoire
1,189,4291 189 429
Kabongo
Haut-Lomami
TerritoryTerritoire
835,624835 624
Kamina
Haut-Lomami
TerritoryTerritoire
693,189693 189
Kaniama
Haut-Lomami
TerritoryTerritoire
319,914319 914
Malemba-Nkulu
Haut-Lomami
TerritoryTerritoire
1,036,1731 036 173
Aba
Haut-Uele
CityVille
—
Dungu
Haut-Uele
TerritoryTerritoire
207,029207 029
Faradje
Haut-Uele
TerritoryTerritoire
389,133389 133
Isiro
Haut-Uele
CityVille
—
Niangara
Haut-Uele
TerritoryTerritoire
121,956121 956
Rungu
Haut-Uele
TerritoryTerritoire
372,419372 419
Wamba
Haut-Uele
TerritoryTerritoire
436,496436 496
Watsa
Haut-Uele
TerritoryTerritoire
299,941299 941
Ariwara
Ituri
CityVille
—
Aru
Ituri
TerritoryTerritoire
1,003,6081 003 608
Bunia
Ituri
CityVille
—
Djugu
Ituri
TerritoryTerritoire
1,820,5661 820 566
Ingbokolo
Ituri
CityVille
—
Irumu
Ituri
TerritoryTerritoire
1,008,5511 008 551
Mahagi
Ituri
TerritoryTerritoire
1,402,0561 402 056
Mambasa
Ituri
TerritoryTerritoire
377,144377 144
Mongwalu
Ituri
CityVille
—
Dekese
Kasaï
TerritoryTerritoire
162,522162 522
Ilebo
Kasaï
TerritoryTerritoire
578,769578 769
Kamonia
Kasaï
TerritoryTerritoire
2,572,9342 572 934
Luebo
Kasaï
TerritoryTerritoire
438,644438 644
Mweka
Kasaï
TerritoryTerritoire
740,091740 091
Tshikapa
Kasaï
CityVille
—
Demba
Kasaï-Central
TerritoryTerritoire
804,123804 123
Dibaya
Kasaï-Central
TerritoryTerritoire
611,334611 334
Dimbelenge
Kasaï-Central
TerritoryTerritoire
462,144462 144
Kananga
Kasaï-Central
CityVille
1,059,4791 059 479
Kazumba
Kasaï-Central
TerritoryTerritoire
959,649959 649
Luiza
Kasaï-Central
TerritoryTerritoire
891,710891 710
Tshimbulu
Kasaï-Central
CityVille
—
Kabeya-Kamwanga
Kasaï-Oriental
TerritoryTerritoire
210,712210 712
Katanda
Kasaï-Oriental
TerritoryTerritoire
444,131444 131
Lukalaba
Kasaï-Oriental
CityVille
—
Lupatapata
Kasaï-Oriental
TerritoryTerritoire
361,281361 281
Mbuji-Mayi
Kasaï-Oriental
CityVille
3,427,5513 427 551
Miabi
Kasaï-Oriental
TerritoryTerritoire
382,797382 797
Tshilenge
Kasaï-Oriental
TerritoryTerritoire
586,853586 853
Kinshasa
Kinshasa
CityVille
9,924,7849 924 784
Bangu
Kongo-Central
CityVille
—
Boma
Kongo-Central
CityVille
178,307178 307
Inkisi
Kongo-Central
CityVille
—
Kasangulu
Kongo-Central
TerritoryTerritoire
251,106251 106
Kimvula
Kongo-Central
TerritoryTerritoire
86,59686 596
Lukula
Kongo-Central
TerritoryTerritoire
340,894340 894
Luozi
Kongo-Central
TerritoryTerritoire
266,208266 208
Madimba
Kongo-Central
TerritoryTerritoire
440,158440 158
Matadi
Kongo-Central
CityVille
340,040340 040
Mbanza-Ngungu
Kongo-Central
TerritoryTerritoire
726,605726 605
Moanda
Kongo-Central
CityVille
355,960355 960
Seke-Banza
Kongo-Central
TerritoryTerritoire
255,964255 964
Songololo
Kongo-Central
TerritoryTerritoire
345,342345 342
Tshela
Kongo-Central
TerritoryTerritoire
431,967431 967
Feshi
Kwango
TerritoryTerritoire
386,581386 581
Kahemba
Kwango
TerritoryTerritoire
430,794430 794
Kasongo-Lunda
Kwango
TerritoryTerritoire
779,666779 666
Kenge
Kwango
TerritoryTerritoire
712,497712 497
Popokabaka
Kwango
TerritoryTerritoire
197,794197 794
Bagata
Kwilu
TerritoryTerritoire
508,532508 532
Bandundu
Kwilu
CityVille
202,944202 944
Bulungu
Kwilu
TerritoryTerritoire
1,239,1901 239 190
Dibaya-Lubwe
Kwilu
CityVille
—
Gungu
Kwilu
TerritoryTerritoire
546,897546 897
Idiofa
Kwilu
TerritoryTerritoire
1,272,8971 272 897
Kikwit
Kwilu
CityVille
506,235506 235
Mangai
Kwilu
CityVille
—
Masi-Manimba
Kwilu
TerritoryTerritoire
741,480741 480
Kabinda
Lomami
TerritoryTerritoire
739,040739 040
Kamiji
Lomami
TerritoryTerritoire
109,616109 616
Lubao
Lomami
TerritoryTerritoire
599,115599 115
Luilu
Lomami
TerritoryTerritoire
948,821948 821
Mwene-Ditu
Lomami
CityVille
742,525742 525
Ngandajika
Lomami
TerritoryTerritoire
852,877852 877
Dilolo
Lualaba
TerritoryTerritoire
498,860498 860
Kapanga
Lualaba
TerritoryTerritoire
274,692274 692
Kasaji
Lualaba
CityVille
—
Kolwezi
Lualaba
CityVille
—
Lubudi
Lualaba
TerritoryTerritoire
579,318579 318
Mutshatsha
Lualaba
TerritoryTerritoire
608,390608 390
Sandoa
Lualaba
TerritoryTerritoire
383,382383 382
Kabambare
Maniema
TerritoryTerritoire
477,265477 265
Kailo
Maniema
TerritoryTerritoire
157,488157 488
Kalima
Maniema
CityVille
—
Kasongo
Maniema
TerritoryTerritoire
674,657674 657
Kibombo
Maniema
TerritoryTerritoire
209,485209 485
Kindu
Maniema
CityVille
289,598289 598
Lubutu
Maniema
TerritoryTerritoire
222,466222 466
Namoya
Maniema
CityVille
—
Pangi
Maniema
TerritoryTerritoire
415,969415 969
Punia
Maniema
TerritoryTerritoire
189,613189 613
Bolobo
Maï-Ndombe
TerritoryTerritoire
149,817149 817
Inongo
Maï-Ndombe
TerritoryTerritoire
408,055408 055
Kiri
Maï-Ndombe
TerritoryTerritoire
203,601203 601
Kutu
Maï-Ndombe
TerritoryTerritoire
407,747407 747
Kwamouth
Maï-Ndombe
TerritoryTerritoire
134,953134 953
Mushie
Maï-Ndombe
TerritoryTerritoire
133,346133 346
Nioki
Maï-Ndombe
CityVille
—
Oshwe
Maï-Ndombe
TerritoryTerritoire
359,302359 302
Yumbi
Maï-Ndombe
TerritoryTerritoire
129,290129 290
Bongandanga
Mongala
TerritoryTerritoire
805,382805 382
Bumba
Mongala
TerritoryTerritoire
1,004,2021 004 202
Lisala
Mongala
TerritoryTerritoire
712,451712 451
Beni
Nord-Kivu
TerritoryTerritoire
421,531421 531
Butembo
Nord-Kivu
CityVille
801,956801 956
Goma
Nord-Kivu
CityVille
955,240955 240
Lubero
Nord-Kivu
TerritoryTerritoire
1,605,2361 605 236
Masisi
Nord-Kivu
TerritoryTerritoire
2,064,3442 064 344
Nyiragongo
Nord-Kivu
TerritoryTerritoire
477,620477 620
Oïcha
Nord-Kivu
CityVille
1,556,6611 556 661
Rutshuru
Nord-Kivu
TerritoryTerritoire
1,709,8771 709 877
Walikale
Nord-Kivu
TerritoryTerritoire
648,187648 187
Bosobolo
Nord-Ubangi
TerritoryTerritoire
383,898383 898
Businga
Nord-Ubangi
TerritoryTerritoire
554,350554 350
Gbadolite
Nord-Ubangi
CityVille
159,005159 005
Mobayi-Mbongo
Nord-Ubangi
TerritoryTerritoire
123,236123 236
Yakoma
Nord-Ubangi
TerritoryTerritoire
361,682361 682
Bena-Dibele
Sankuru
CityVille
—
Katako-Kombe
Sankuru
TerritoryTerritoire
341,550341 550
Kole
Sankuru
TerritoryTerritoire
198,311198 311
Lodja
Sankuru
TerritoryTerritoire
500,960500 960
Lomela
Sankuru
TerritoryTerritoire
217,420217 420
Lubefu
Sankuru
TerritoryTerritoire
454,681454 681
Lusambo
Sankuru
TerritoryTerritoire
334,607334 607
Tshumbe
Sankuru
CityVille
—
Baraka
Sud-Kivu
CityVille
—
Bukavu
Sud-Kivu
CityVille
968,501968 501
Fizi
Sud-Kivu
TerritoryTerritoire
853,637853 637
Idjwi
Sud-Kivu
TerritoryTerritoire
287,940287 940
Kabare
Sud-Kivu
TerritoryTerritoire
1,050,7031 050 703
Kalehe
Sud-Kivu
TerritoryTerritoire
856,819856 819
Kamituga
Sud-Kivu
CityVille
—
Mwenga
Sud-Kivu
TerritoryTerritoire
760,815760 815
Shabunda
Sud-Kivu
TerritoryTerritoire
683,289683 289
Uvira
Sud-Kivu
TerritoryTerritoire
870,290870 290
Walungu
Sud-Kivu
TerritoryTerritoire
772,956772 956
Budjala
Sud-Ubangi
TerritoryTerritoire
642,765642 765
Gemena
Sud-Ubangi
TerritoryTerritoire
1,241,8671 241 867
Kungu
Sud-Ubangi
TerritoryTerritoire
488,401488 401
Libenge
Sud-Ubangi
TerritoryTerritoire
417,534417 534
Zongo
Sud-Ubangi
CityVille
81,88981 889
Kabalo
Tanganyika
TerritoryTerritoire
280,411280 411
Kalemie
Tanganyika
TerritoryTerritoire
721,683721 683
Kaoze
Tanganyika
CityVille
—
Kongolo
Tanganyika
TerritoryTerritoire
546,781546 781
Manono
Tanganyika
TerritoryTerritoire
781,118781 118
Moba
Tanganyika
TerritoryTerritoire
540,295540 295
Nyunzu
Tanganyika
TerritoryTerritoire
288,040288 040
Bafwasende
Tshopo
TerritoryTerritoire
223,603223 603
Banalia
Tshopo
TerritoryTerritoire
273,210273 210
Basoko
Tshopo
TerritoryTerritoire
363,228363 228
Isangi
Tshopo
TerritoryTerritoire
599,712599 712
Kisangani
Tshopo
CityVille
893,612893 612
Opala
Tshopo
TerritoryTerritoire
280,146280 146
Ubundu
Tshopo
TerritoryTerritoire
331,687331 687
Yahuma
Tshopo
TerritoryTerritoire
193,963193 963
Yangambi
Tshopo
CityVille
—
Befale
Tshuapa
TerritoryTerritoire
329,164329 164
Boende
Tshuapa
TerritoryTerritoire
289,606289 606
Bokungu
Tshuapa
TerritoryTerritoire
628,430628 430
Djolu
Tshuapa
TerritoryTerritoire
381,150381 150
Ikela
Tshuapa
TerritoryTerritoire
352,898352 898
Monkoto
Tshuapa
TerritoryTerritoire
138,646138 646
A dash marks an urban entity whose population is counted inside the neighbouring entity in the source, so that no inhabitant is counted twice. The territory of Muanda (Kongo-Central) appears here under the urban entity Moanda.Un tiret signale une entité urbaine dont la population est comptée dans l’entité voisine à la source, de sorte qu’aucun habitant n’est compté deux fois. Le territoire de Muanda (Kongo-Central) figure ici sous l’entité urbaine de Moanda.
Two million abroad, one million withinDeux millions dehors, un million dedans
Some two million Congolese live outside the country and about the same number of foreigners live inside it, which makes the DRC one of the few African states that is simultaneously a large sender, a large host and a large producer of refugees. The money that follows those people home is now worth two to three billion dollars a year, of the same order as the entire mining tax take, and it is counted with far less precision. Internal movement is the gap in this section, and it is a real one: there has been no census since 1984, so no inter-provincial migration matrix exists to be reproduced here.
Quelque deux millions de Congolais vivent hors du pays et à peu près autant d’étrangers y vivent, ce qui fait de la RD Congo l’un des rares États africains à être en même temps un grand pays de départ, un grand pays d’accueil et un grand producteur de réfugiés. L’argent qui suit ces personnes jusqu’au pays vaut aujourd’hui deux à trois milliards de dollars l’an, du même ordre que la totalité des recettes minières, et il est compté avec bien moins de précision. Le mouvement interne est le manque de cette section, et c’est un manque réel : aucun recensement depuis 1984, donc aucune matrice de migration interprovinciale à reproduire ici.
Personal remittances receivedEnvois de fonds des migrants reçus
Figure by James Wabenga Yango. Source: Banque mondiale, World Development Indicators, séries BX.TRF.PWKR.CD.DT et BX.TRF.PWKR.DT.GD.ZS, d’après les statistiques de balance des paiements du FMI ; millésime de la base du 13 juillet 2026.Figure de James Wabenga Yango. Source : Banque mondiale, World Development Indicators, séries BX.TRF.PWKR.CD.DT et BX.TRF.PWKR.DT.GD.ZS, d’après les statistiques de balance des paiements du FMI ; millésime de la base du 13 juillet 2026.How to citeComment citer
Remittances are the second largest current inflow after mineral exports, and at their 2023 peak they were worth about half of foreign direct investment. The series is not smooth and this page does not smooth it: it falls by a third in 2020, roughly triples between 2021 and 2022, and falls by two fifths again in 2024. The Bank publishes no revision note that would let a reader say which of the flow or its measurement changed, so the jumps are printed as they stand. The figures are Fund balance of payments data completed by Bank staff estimates, which is to say that informal transfers, believed to be large in the DRC, are captured only to the extent that the estimate captures them.Les envois de fonds sont la deuxième entrée courante après les exportations minières, et à leur sommet de 2023 ils valaient environ la moitié de l’investissement direct étranger. La série n’est pas lisse et cette page ne la lisse pas : elle recule d’un tiers en 2020, à peu près triple entre 2021 et 2022, et retombe de deux cinquièmes en 2024. La Banque ne publie aucune note de révision qui permettrait de dire ce qui, du flux ou de sa mesure, a changé : les sauts sont donc imprimés tels quels. Les chiffres sont des données de balance des paiements du Fonds complétées par des estimations des services de la Banque, c’est-à-dire que les transferts informels, réputés importants en RD Congo, n’y sont saisis que dans la mesure où l’estimation les saisit.
Source:Source : Banque mondiale, World Development Indicators, séries BX.TRF.PWKR.CD.DT et BX.TRF.PWKR.DT.GD.ZS, d’après les statistiques de balance des paiements du FMI ; millésime de la base du 13 juillet 2026.
Table compiled by James Wabenga Yango.Tableau composé par James Wabenga Yango.How to citeComment citer
Congolese-born people living abroad, 2024Personnes nées en RD Congo vivant à l’étranger, 2024
Figure by James Wabenga Yango. Source: Nations unies, Département des affaires économiques et sociales, International Migrant Stock 2024 (POP/DB/MIG/Stock/Rev.2024), publié en janvier 2025.Figure de James Wabenga Yango. Source : Nations unies, Département des affaires économiques et sociales, International Migrant Stock 2024 (POP/DB/MIG/Stock/Rev.2024), publié en janvier 2025.How to citeComment citer
The Congolese diaspora numbered 2.10 million in mid-2024, against 1.92 million in 2020. The thirteen countries listed hold about ninety-three per cent of it. The geography deserves a second look: eleven of the thirteen are African and the four largest are immediate neighbours, so most Congolese emigration is regional and much of it is displacement that has settled. France, Belgium and Canada together hold about a eighth of the total, which is the part of the diaspora that the remittance series above mostly reflects.La diaspora congolaise comptait 2,10 millions de personnes à la mi-2024, contre 1,92 million en 2020. Les treize pays énumérés en portent environ quatre-vingt-treize pour cent. La géographie mérite un second regard : onze des treize sont africains et les quatre premiers sont des voisins immédiats, de sorte que l’essentiel de l’émigration congolaise est régional et qu’une bonne part en est un déplacement qui s’est installé. La France, la Belgique et le Canada réunis en portent environ un huitième, et c’est cette part de la diaspora que reflète surtout la série d’envois de fonds ci-dessus.
Source:Source : Nations unies, Département des affaires économiques et sociales, International Migrant Stock 2024 (POP/DB/MIG/Stock/Rev.2024), publié en janvier 2025.
Table compiled by James Wabenga Yango.Tableau composé par James Wabenga Yango.How to citeComment citer
Congolese refugees and asylum seekers, by country of asylumRéfugiés et demandeurs d’asile congolais, par pays d’asile
Figure by James Wabenga Yango. Source: HCR, portail des données opérationnelles, situation RD Congo, relevés du 31 mars et du 30 avril 2026.Figure de James Wabenga Yango. Source : HCR, portail des données opérationnelles, situation RD Congo, relevés du 31 mars et du 30 avril 2026.How to citeComment citer
Read this table against the one above it. Of the 2.10 million Congolese living abroad, 1.24 million are registered as refugees or asylum seekers, and 657 thousand of those are in Uganda alone: more than half of the Congolese refugee population is in one country, and the Ugandan figure comes from the government rather than from the agency. The portal covers African countries of asylum only, so the total is a floor and not a world count. Figures are dated 31 March 2026, except Malawi, South Sudan and the total, which are dated 30 April 2026.Ce tableau se lit contre celui qui le précède. Sur les 2,10 millions de Congolais vivant à l’étranger, 1,24 million sont enregistrés comme réfugiés ou demandeurs d’asile, et 657 mille d’entre eux se trouvent en Ouganda seul : plus de la moitié de la population réfugiée congolaise tient dans un seul pays, et le chiffre ougandais provient du gouvernement et non de l’agence. Le portail ne couvre que les pays d’asile africains : le total est donc un plancher et non un décompte mondial. Les chiffres sont arrêtés au 31 mars 2026, sauf le Malawi, le Soudan du Sud et le total, arrêtés au 30 avril 2026.
Source:Source : HCR, portail des données opérationnelles, situation RD Congo, relevés du 31 mars et du 30 avril 2026.
Table compiled by James Wabenga Yango.Tableau composé par James Wabenga Yango.How to citeComment citer
Foreign-born people living in the DRC, 2024Personnes nées à l’étranger vivant en RD Congo, 2024
Figure by James Wabenga Yango. Source: Nations unies, Département des affaires économiques et sociales, International Migrant Stock 2024 (POP/DB/MIG/Stock/Rev.2024), publié en janvier 2025.Figure de James Wabenga Yango. Source : Nations unies, Département des affaires économiques et sociales, International Migrant Stock 2024 (POP/DB/MIG/Stock/Rev.2024), publié en janvier 2025.How to citeComment citer
The DRC receives as well as sends. One and a nine tenths million foreign-born residents is about one per cent of the population, and 51.8 per cent of them are women. The stock fell from 754 thousand in 1990 to 590 thousand in 2010 before rising to its present level, which tracks the conflicts of the neighbours rather than any Congolese immigration policy. Against a diaspora of 2.10 million, the country is a net sender by roughly a million people.La RD Congo reçoit autant qu’elle envoie. Un million quatre-vingt-cinq mille résidents nés à l’étranger, c’est environ un pour cent de la population, et 51,8 pour cent d’entre eux sont des femmes. Le stock est tombé de 754 mille en 1990 à 590 mille en 2010 avant de remonter à son niveau actuel, ce qui suit les conflits des voisins plutôt qu’une quelconque politique congolaise d’immigration. Face à une diaspora de 2,10 millions, le pays est émetteur net d’environ un million de personnes.
Source:Source : Nations unies, Département des affaires économiques et sociales, International Migrant Stock 2024 (POP/DB/MIG/Stock/Rev.2024), publié en janvier 2025.
Table compiled by James Wabenga Yango.Tableau composé par James Wabenga Yango.How to citeComment citer
Internal migration: what is publishedMigration interne : ce qui est publié
ItemÉlément
ValueValeur
WhereOù
Inter-provincial migration matrixMatrice des migrations interprovinciales
Not publishedNon publiée
No census since 1984Aucun recensement depuis 1984
Residents who have not always lived in their locality, 2012Résidents n’ayant pas toujours vécu dans leur localité, 2012
Migrants who came from abroadMigrants venus de l’étranger
1,3 %1,3 %
Survey 1-2-3, phase 1Enquête 1-2-3, phase 1
Latest general population censusDernier recensement général de la population
19841984
Institut national de la statistiqueInstitut national de la statistique
Inter-provincial and intra-provincial migration is the clearest gap on this page, and it is worth being explicit about why. A migration matrix needs a census, and the last scientific census in the DRC was taken in 1984. The statistical institute’s portal was still marked as under construction in August 2026 and publishes no library; the Organization for Migration counts conflict displacement, which is a different thing and is set out in the security tab. What survives is the 1-2-3 survey of 2012, which asks whether a person has always lived where they now live: about one Congolese in five had not. That is a lifetime migration rate, not a flow, and it is fourteen years old. No matrix is constructed here from it, because none can honestly be.La migration interprovinciale et intraprovinciale est la lacune la plus nette de cette page, et il vaut la peine de dire pourquoi. Une matrice de migration demande un recensement, et le dernier recensement scientifique de la RD Congo date de 1984. Le portail de l’institut national de la statistique était encore annoncé comme en construction en août 2026 et ne publie aucune bibliothèque ; l’Organisation pour les migrations dénombre les déplacements liés au conflit, ce qui est autre chose et figure dans l’onglet sécurité. Il reste l’enquête 1-2-3 de 2012, qui demande si l’enquêté a toujours vécu là où il vit : environ un Congolais sur cinq n’y avait pas toujours vécu. C’est un taux de migration à vie, non un flux, et il a quatorze ans. Aucune matrice n’en est tirée ici, parce qu’aucune ne peut honnêtement l’être.
Source:Source : Kankwanda, Makabu, Nilsson, Roubaud, Torelli et Wachsberger, « Le marché du travail en République démocratique du Congo en 2012 : principaux résultats de la phase 1 de l’enquête 1-2-3 », DIAL-IRD, document de travail DT/2014-23, 2014, d’après l’enquête 1-2-3 de l’Institut national de la statistique.
Table compiled by James Wabenga Yango.Tableau composé par James Wabenga Yango.How to citeComment citer
What growth has and has not doneCe que la croissance a fait et ce qu’elle n’a pas fait
The DRC grew at five to nine per cent a year through most of the past decade, and four Congolese in five still live below three dollars a day. The tables below hold those two facts together, which is the whole difficulty. They also carry an unusual amount of methodological warning, and deliberately so: the household surveys behind every poverty figure rest on a sampling frame drawn from the census of 1984, and no reader should take a decimal point here as seriously as a decimal point in the fiscal tables. The last two tables turn to governance, which belongs here rather than in a section of its own: a state that scores twenty out of a hundred on perceived corruption and 2,5 out of 6 on the transparency of its own public accounts is a state whose spending on health and schools is worth reading with the same caution as its poverty rate.
La RD Congo a cru de cinq à neuf pour cent l’an sur l’essentiel de la dernière décennie, et quatre Congolais sur cinq vivent toujours sous trois dollars par jour. Les tableaux qui suivent tiennent ensemble ces deux faits, et c’est là toute la difficulté. Ils portent aussi une somme inhabituelle d’avertissements de méthode, et à dessein : les enquêtes de ménages qui fondent tout chiffre de pauvreté reposent sur une base de sondage tirée du recensement de 1984, et nul ne devrait prendre ici une décimale aussi au sérieux qu’une décimale des tableaux budgétaires. Les deux derniers tableaux passent à la gouvernance, qui a sa place ici plutôt que dans une section à elle : un État qui obtient vingt sur cent en perception de la corruption et 2,5 sur 6 sur la transparence de ses propres comptes publics est un État dont la dépense de santé et d’école se lit avec la même prudence que son taux de pauvreté.
Figure by James Wabenga Yango. Source: Banque mondiale, Poverty and Equity Brief — Democratic Republic of Congo, octobre 2025. PNUD, Rapport sur le développement humain 2025, annexe statistique.Figure de James Wabenga Yango. Source : Banque mondiale, Poverty and Equity Brief — Democratic Republic of Congo, octobre 2025. PNUD, Rapport sur le développement humain 2025, annexe statistique.How to citeComment citer
Income share of the poorest 40 per cent, %Part de revenu des 40 % les plus pauvres, %
15.115,1
2010-2023
Income share of the richest 10 per cent, %Part de revenu des 10 % les plus riches, %
35.735,7
2010-2023
Human development index adjusted for inequalityIndice de développement humain ajusté aux inégalités
0.30,3
2023
Every poverty and inequality figure for the DRC rests on a household survey whose sampling frame is still the census of 1984, and the Bank states plainly that the 2005, 2012 and 2020 surveys are not fully comparable and that no consistent consumer price series exists to deflate them. A consumption survey completed in December 2024 was still being cleaned in late 2025. The right way to read the table is as an order of magnitude that has not moved: four Congolese in five live below three dollars a day, and the gap between the towns and the countryside is nearly twenty points. The Bank’s own October 2025 brief also carries a nowcast of nearly fifty million poor in 2024 which cannot be reconciled with the 2020 tabulation and appears to be left over from the earlier 2.15-dollar line.Tout chiffre de pauvreté ou d’inégalité pour la RD Congo repose sur une enquête de ménages dont la base de sondage reste le recensement de 1984, et la Banque dit clairement que les enquêtes de 2005, 2012 et 2020 ne sont pas pleinement comparables et qu’aucune série de prix cohérente ne permet de les déflater. Une enquête de consommation achevée en décembre 2024 était encore en cours d’apurement fin 2025. Le tableau se lit donc comme un ordre de grandeur qui n’a pas bougé : quatre Congolais sur cinq vivent sous trois dollars par jour, et l’écart entre la ville et la campagne approche vingt points. La note de la Banque d’octobre 2025 avance par ailleurs une estimation de près de cinquante millions de pauvres en 2024, inconciliable avec la tabulation de 2020 et qui semble héritée de l’ancien seuil de 2,15 dollars.
Source:Source : Banque mondiale, Poverty and Equity Brief — Democratic Republic of Congo, octobre 2025. PNUD, Rapport sur le développement humain 2025, annexe statistique.
Table compiled by James Wabenga Yango.Tableau composé par James Wabenga Yango.How to citeComment citer
Poverty, the projected pathPauvreté, la trajectoire projetée
Figure by James Wabenga Yango. Source: Banque mondiale, Macro Poverty Outlook, édition d’avril 2026, fiche République démocratique du Congo ; seuils de pauvreté en parités de pouvoir d’achat de 2021.Figure de James Wabenga Yango. Source : Banque mondiale, Macro Poverty Outlook, édition d’avril 2026, fiche République démocratique du Congo ; seuils de pauvreté en parités de pouvoir d’achat de 2021.How to citeComment citer
Not one of these twelve numbers is a measurement. The last household survey with a usable consumption module is the survey of 2020; everything after it is obtained by applying the growth of output per head to the 2020 distribution, with a pass-through of 0.7 and no change in inequality, as the Bank states in its own note. The table is therefore an arithmetical projection of growth, not a measurement of poverty, and it should be read for its shape rather than its decimals: at the growth rate the Bank itself forecasts, the poverty rate falls by half a point a year, which puts the end of extreme poverty beyond the end of the century. The interesting line is the third: at 8.30 dollars a day, the rate does not move at all.Aucun de ces douze nombres n’est une mesure. La dernière enquête de ménages dotée d’un module de consommation utilisable est celle de 2020 ; tout ce qui suit est obtenu en appliquant la croissance du produit par habitant à la distribution de 2020, avec une transmission de 0,7 et à inégalité inchangée, comme la Banque le dit elle-même en note. Le tableau est donc une projection arithmétique de la croissance et non une mesure de la pauvreté ; il se lit pour sa forme et non pour ses décimales : au rythme de croissance que la Banque prévoit elle-même, le taux de pauvreté baisse d’un demi-point l’an, ce qui reporte la fin de la pauvreté extrême au-delà de la fin du siècle. La ligne intéressante est la troisième : à 8,30 dollars par jour, le taux ne bouge pas du tout.
Source:Source : Banque mondiale, Macro Poverty Outlook, édition d’avril 2026, fiche République démocratique du Congo ; seuils de pauvreté en parités de pouvoir d’achat de 2021.
Table compiled by James Wabenga Yango.Tableau composé par James Wabenga Yango.How to citeComment citer
Figure by James Wabenga Yango. Source: PNUD et Oxford Poverty and Human Development Initiative, Global Multidimensional Poverty Index 2025, profil de la République démocratique du Congo ; enquête sous-jacente de 2017-2018, effectifs projetés sur la population de 2023.Figure de James Wabenga Yango. Source : PNUD et Oxford Poverty and Human Development Initiative, Global Multidimensional Poverty Index 2025, profil de la République démocratique du Congo ; enquête sous-jacente de 2017-2018, effectifs projetés sur la population de 2023.How to citeComment citer
Share of the population who are multidimensionally poor, %Part de la population pauvre multidimensionnellement, %
64.564,5
Intensity of deprivation, %Intensité de la privation, %
51.351,3
People multidimensionally poor, millionsPersonnes pauvres multidimensionnellement, millions
68.368,3
In severe multidimensional poverty, %En pauvreté multidimensionnelle sévère, %
36.836,8
Vulnerable to multidimensional poverty, %Vulnérables à la pauvreté multidimensionnelle, %
17.417,4
Contribution of the standard of living dimension, %Contribution de la dimension niveau de vie, %
57.057,0
The index itself is 0.331. It counts deprivations rather than money: a household is poor when it is deprived in a third of ten weighted indicators covering health, education and the standard of living. The index itself is the product of the two lines above it, incidence times intensity, which is why 0.645 × 0.513 gives 0.331. Two remarks. The measured rate, 64.5 per cent, is twenty points below the monetary rate of 85.3 per cent at three dollars a day, and the difference is not a contradiction: a household can have a roof, a school and a clinic and still have almost no cash income. And more than half of the index comes from the standard-of-living dimension alone (cooking fuel, electricity, water, sanitation, housing), which is to say from infrastructure. The underlying survey dates from 2017-2018; the World Bank publishes a different multidimensional measure, at 88 per cent for 2020, which is not comparable with this one.L’indice vaut 0,331. Il compte des privations et non de l’argent : un ménage est pauvre lorsqu’il est privé sur un tiers de dix indicateurs pondérés couvrant la santé, l’éducation et le niveau de vie. L’indice est lui-même le produit des deux lignes qui le suivent, incidence fois intensité, d’où 0,645 × 0,513 = 0,331. Deux remarques. Le taux mesuré, 64,5 pour cent, est de vingt points inférieur au taux monétaire de 85,3 pour cent à trois dollars par jour, et la différence n’est pas une contradiction : un ménage peut avoir un toit, une école et un dispensaire et n’avoir presque aucun revenu monétaire. Plus de la moitié de l’indice vient par ailleurs de la seule dimension du niveau de vie (combustible de cuisson, électricité, eau, assainissement, logement), c’est-à-dire des infrastructures. L’enquête sous-jacente date de 2017-2018 ; la Banque mondiale publie une autre mesure multidimensionnelle, de 88 pour cent pour 2020, qui ne se compare pas à celle-ci.
Source:Source : PNUD et Oxford Poverty and Human Development Initiative, Global Multidimensional Poverty Index 2025, profil de la République démocratique du Congo ; enquête sous-jacente de 2017-2018, effectifs projetés sur la population de 2023.
Table compiled by James Wabenga Yango.Tableau composé par James Wabenga Yango.How to citeComment citer
Human development and governanceDéveloppement humain et gouvernance
IndicatorIndicateur
ValueValeur
Reference yearAnnée de référence
SourceSource
Human development indexIndice de développement humain
0.5220,522
2023
UNDPPNUD
World rank, out of 193Rang mondial, sur 193
171.000171,000
2023
UNDPPNUD
Life expectancy at birth, yearsEspérance de vie à la naissance, années
61.90061,900
2023
UNDPPNUD
Expected years of schoolingDurée attendue de scolarisation, années
10.90010,900
2023
UNDPPNUD
Mean years of schoolingDurée moyenne de scolarisation, années
7.4007,400
2023
UNDPPNUD
Gross national income per capita, 2021 PPP $Revenu national brut par habitant, USD PPA 2021
1,431.0001 431,000
2023
UNDPPNUD
Corruption perceptions index, score out of 100Indice de perception de la corruption, note sur 100
20.00020,000
2025
Transparency InternationalTransparency International
Corruption perceptions index, rank out of 182Indice de perception de la corruption, rang sur 182
163.000163,000
2025
Transparency InternationalTransparency International
Human capital indexIndice de capital humain
0.3660,366
2020
World BankBanque mondiale
Statistical performance indicatorIndicateur de performance statistique
46.30046,300
2024
World BankBanque mondiale
The corruption index moved by nothing at all over the years for which it is published, which is itself the finding: perceptions of governance in the DRC are stable and low. The statistical performance indicator is worth keeping in view on a page of this kind, since it measures the quality of the very apparatus that produces every other number here. The World Bank’s governance indicators were rebased in December 2025 onto an absolute scale and their percentile ranks are no longer the headline presentation, so they are left out rather than quoted from a superseded vintage.L’indice de perception de la corruption n’a pas bougé sur les années publiées, et c’est là le résultat : la perception de la gouvernance en RD Congo est stable et basse. L’indicateur de performance statistique mérite de figurer sur une page de cette nature, puisqu’il mesure la qualité de l’appareil même qui produit tous les autres chiffres. Les indicateurs de gouvernance de la Banque mondiale ont été rebasés en décembre 2025 sur une échelle absolue et leurs rangs centiles ne sont plus la présentation de référence : ils sont laissés de côté plutôt que cités d’un millésime périmé.
Source:Source : PNUD, Rapport sur le développement humain 2025, annexe statistique. Transparency International, indice de perception de la corruption 2025. Banque mondiale, World Development Indicators, fiche pays consultée en août 2026.
Table compiled by James Wabenga Yango.Tableau composé par James Wabenga Yango.How to citeComment citer
Access to basic servicesAccès aux services de base
Figure by James Wabenga Yango. Source: Banque mondiale, World Development Indicators, fiche pays consultée en août 2026. Institut de statistique de l’UNESCO, profil pays ODD 4, République démocratique du Congo, juin 2025.Figure de James Wabenga Yango. Source : Banque mondiale, World Development Indicators, fiche pays consultée en août 2026. Institut de statistique de l’UNESCO, profil pays ODD 4, République démocratique du Congo, juin 2025.How to citeComment citer
Population with access to electricityPopulation ayant accès à l’électricité
22.522,5
2024
Population with safely managed sanitationPopulation disposant d’un assainissement géré en sécurité
13.013,0
2024
Individuals using the internetPersonnes utilisant internet
20.020,0
2024
Population without at least limited drinking waterPopulation sans eau de boisson au moins limitée
45.345,3
2020
Population without at least limited sanitationPopulation sans assainissement au moins limité
81.781,7
2020
Primary schools with electricityÉcoles primaires raccordées à l’électricité
10.010,0
2023
Primary schools with basic drinking waterÉcoles primaires disposant d’eau de boisson
37.337,3
2023
Public spending on education, per cent of GDPDépense publique d’éducation, en % du PIB
2.82,8
2022
Public spending on education, per cent of budgetDépense publique d’éducation, en % du budget
18.418,4
2022
Electricity access is the binding constraint that the input-output table on this page cannot see: a country whose installed capacity is a fraction of its peak demand cannot move mining one step downstream, whatever the network multipliers say. Rural access, widely reported at around one per cent, is not tabulated in a source that could be verified and is therefore left out. The 2020 water and sanitation lines come from the household survey and use a different definition from the 2024 service indicators, so the two vintages are not to be differenced.L’accès à l’électricité est la contrainte que le tableau entrées-sorties de cette page ne peut pas voir : un pays dont la capacité installée ne couvre qu’une fraction de la demande de pointe ne peut pas déplacer la mine d’un cran vers l’aval, quoi que disent les multiplicateurs de réseau. L’accès rural, souvent avancé autour de un pour cent, n’est tabulé dans aucune source vérifiable et reste donc absent. Les lignes eau et assainissement de 2020 viennent de l’enquête de ménages et n’emploient pas la définition des indicateurs de service de 2024 : on ne différencie pas les deux millésimes.
Source:Source : Banque mondiale, World Development Indicators, fiche pays consultée en août 2026. Institut de statistique de l’UNESCO, profil pays ODD 4, République démocratique du Congo, juin 2025.
Table compiled by James Wabenga Yango.Tableau composé par James Wabenga Yango.How to citeComment citer
Figure by James Wabenga Yango. Source: Institut de statistique de l’UNESCO, profil pays ODD 4, République démocratique du Congo, juin 2025.Figure de James Wabenga Yango. Source : Institut de statistique de l’UNESCO, profil pays ODD 4, République démocratique du Congo, juin 2025.How to citeComment citer
Lower secondary completionAchèvement du premier cycle du secondaire
41.541,5
50.450,4
8.98,9
Upper secondary completionAchèvement du second cycle du secondaire
17.517,5
22.522,5
5.05,0
Out of school, primary ageEnfants non scolarisés, âge du primaire
24.024,0
17.017,0
-7.0-7,0
These are modelled estimates, not survey readings. The surveys of 2013 and 2018 put primary completion higher, at 68.9 and 66.7 per cent, and lower secondary completion at 53.5 and 54.4; the gap between the modelled and the surveyed series is a caution about both. The out-of-school line is for 2023, the last year the source models it. What survives the measurement problem is the shape: completion rises at every level, and falls by more than half between the start and the end of schooling.Ce sont des estimations modélisées, non des relevés d’enquête. Les enquêtes de 2013 et de 2018 situent l’achèvement du primaire plus haut, à 68,9 et 66,7 pour cent, et celui du premier cycle du secondaire à 53,5 et 54,4 ; l’écart entre série modélisée et série enquêtée invite à la prudence sur les deux. La ligne des enfants non scolarisés porte sur 2023, dernière année modélisée par la source. Ce qui survit au problème de mesure, c’est la forme : l’achèvement progresse à tous les niveaux, et se réduit de plus de moitié entre le début et la fin de la scolarité.
Source:Source : Institut de statistique de l’UNESCO, profil pays ODD 4, République démocratique du Congo, juin 2025.
Table compiled by James Wabenga Yango.Tableau composé par James Wabenga Yango.How to citeComment citer
Figure by James Wabenga Yango. Source: IPC, République démocratique du Congo, mise à jour de la projection d’insécurité alimentaire aiguë janvier-juin 2026, 12 mai 2026.Figure de James Wabenga Yango. Source : IPC, République démocratique du Congo, mise à jour de la projection d’insécurité alimentaire aiguë janvier-juin 2026, 12 mai 2026.How to citeComment citer
Phase 3 and above, millionsPhase 3 et au-delà, millions
Share of the population analysed, %Part de la population analysée, %
Phase 4, millionsPhase 4, millions
September to December 2025Septembre à décembre 2025
24.824,8
2121
3.23,2
January to June 2026Janvier à juin 2026
26.526,5
2323
3.63,6
The analysis covers 117 million people, the population base drawn from the statistical institute’s 2026 estimates. Phase 3 is crisis, phase 4 emergency; the phase 4 figures are floors, since the source gives them as more than. Nearly ten million of the twenty-six and a half are in the four eastern provinces alone, which is where the displacement figures in the next tab also concentrate.L’analyse porte sur 117 millions de personnes, base de population tirée des estimations 2026 de l’institut de la statistique. La phase 3 désigne la crise, la phase 4 l’urgence ; les chiffres de phase 4 sont des planchers, la source les donnant comme des minima. Près de dix millions des vingt-six et demi se trouvent dans les quatre provinces de l’Est à elles seules, là où se concentrent aussi les déplacements de l’onglet suivant.
Source:Source : IPC, République démocratique du Congo, mise à jour de la projection d’insécurité alimentaire aiguë janvier-juin 2026, 12 mai 2026.
Table compiled by James Wabenga Yango.Tableau composé par James Wabenga Yango.How to citeComment citer
Corruption Perceptions Index, 2019 to 2025Indice de perception de la corruption, 2019 à 2025
Figure by James Wabenga Yango. Source: Transparency International, indice de perception de la corruption, éditions 2019 à 2025 ; l’édition 2025 a paru le 10 février 2026.Figure de James Wabenga Yango. Source : Transparency International, indice de perception de la corruption, éditions 2019 à 2025 ; l’édition 2025 a paru le 10 février 2026.How to citeComment citer
The score has moved by two points in seven years and has not moved at all since 2022, which is the finding: on this measure nothing has changed. The rank improved from 170th to 163rd over the same period, but ranks are the weaker reading, because the number of countries ranked changed and because a country can rise in the ranking without improving. The four missing ranks are missing because Transparency International stopped printing a rank column in its report from the 2021 edition onward; the ranks survive only in a spreadsheet this page could not read, and no rank is reconstructed here.Le score a bougé de deux points en sept ans et n’a plus bougé du tout depuis 2022 : c’est là le constat, rien n’a changé sur cette mesure. Le rang s’est amélioré de la 170ᵉ à la 163ᵉ place sur la même période, mais le rang est la lecture la plus faible, parce que le nombre de pays classés a changé et parce qu’un pays peut monter au classement sans s’améliorer. Les quatre rangs manquants manquent parce que Transparency International a cessé d’imprimer une colonne de rang dans son rapport à partir de l’édition 2021 ; les rangs ne subsistent que dans un classeur que cette page n’a pas pu lire, et aucun rang n’est reconstitué ici.
Source:Source : Transparency International, indice de perception de la corruption, éditions 2019 à 2025 ; l’édition 2025 a paru le 10 février 2026.
Table compiled by James Wabenga Yango.Tableau composé par James Wabenga Yango.How to citeComment citer
Governance, transparency and the public sectorGouvernance, transparence et secteur public
IndicatorIndicateur
ValueValeur
Source and yearSource et année
Corruption Perceptions IndexIndice de perception de la corruption
EITI Board, October 2022Conseil de l’ITIE, octobre 2022
Worldwide Governance Indicators, percentile ranksIndicateurs mondiaux de gouvernance, rangs centiles
DiscontinuedAbandonnés
World Bank, 2025 revisionBanque mondiale, révision 2025
Four institutions measure roughly the same thing and agree: the DRC scores between a fifth and a half of the available marks on every scale in this table. The one exception is instructive. The country scores 85.5 on the extractive transparency initiative’s own validation, which is a high mark, and 41 on budget transparency at large. Publishing what the mines pay is a solved problem; publishing what the state does with it is not. The last line records a methodological loss rather than a Congolese one: the Bank discontinued percentile ranks in its 2025 revision of the governance indicators, so the six familiar percentiles cannot be shown for any country, and none is estimated here. The Ibrahim edition is dated 2024 but its reference year is 2023.Quatre institutions mesurent à peu près la même chose et s’accordent : la RD Congo obtient entre un cinquième et la moitié des points disponibles sur chacune des échelles de ce tableau. L’unique exception est instructive. Le pays obtient 85,5 à la validation de l’initiative pour la transparence des industries extractives, ce qui est une note élevée, et 41 à la transparence budgétaire d’ensemble. Publier ce que les mines versent est un problème résolu ; publier ce que l’État en fait ne l’est pas. La dernière ligne enregistre une perte méthodologique et non une perte congolaise : la Banque a abandonné les rangs centiles dans sa révision 2025 des indicateurs de gouvernance, de sorte que les six centiles familiers ne peuvent plus être montrés pour aucun pays, et qu’aucun n’est estimé ici. L’édition Ibrahim est datée de 2024 mais son année de référence est 2023.
Source:Source : Transparency International, indice de perception de la corruption 2025. Banque mondiale, Country Policy and Institutional Assessment, fiche République démocratique du Congo, exercice 2024. Fondation Mo Ibrahim, indice Ibrahim de la gouvernance africaine, édition 2024, fiche RD Congo ; année de référence 2023. International Budget Partnership, Open Budget Survey 2025, fiche République démocratique du Congo ; situation arrêtée au 31 décembre 2024. Conseil d’administration de l’ITIE, décision 2022-50/BM-54 du 13 octobre 2022.
Table compiled by James Wabenga Yango.Tableau composé par James Wabenga Yango.How to citeComment citer
Who works, and what a worker producesQui travaille, et ce que produit un travailleur
This section answers three questions that are usually confused with one another: how many Congolese are without work, what kind of work the others do, and what an hour of that work produces. The first question has the least interesting answer, because a measured unemployment rate of four per cent says more about the definition of unemployment than about the country. The second and the third carry the substance: eight workers in ten are in vulnerable employment, a Congolese worker produces about a quarter of what the average sub-Saharan worker produces, and half of the growth of the past quarter century came from new workers rather than from better ones. The last four tables are computed rather than quoted, from World Bank and Labour Organization series, and each states its method under it.
Cette section répond à trois questions que l’on confond d’ordinaire : combien de Congolais sont sans travail, quel travail font les autres, et ce que produit une heure de ce travail. La première question a la réponse la moins intéressante, car un taux de chômage mesuré à quatre pour cent dit davantage sur la définition du chômage que sur le pays. La deuxième et la troisième portent la matière : huit travailleurs sur dix sont en emploi vulnérable, un travailleur congolais produit environ le quart de ce que produit le travailleur subsaharien moyen, et la moitié de la croissance du dernier quart de siècle est venue de travailleurs nouveaux plutôt que de travailleurs plus productifs. Les quatre derniers tableaux sont calculés et non cités, à partir des séries de la Banque mondiale et de l’Organisation du travail, et chacun porte sa méthode sous lui.
Unemployment, participation and employment, modelled estimatesChômage, activité et emploi, estimations modélisées
Figure by James Wabenga Yango. Source: Organisation internationale du travail, estimations modélisées (ILO modelled estimates), servies par les Indicateurs du développement dans le monde de la Banque mondiale, extraction du 13 juillet 2026.Figure de James Wabenga Yango. Source : Organisation internationale du travail, estimations modélisées (ILO modelled estimates), servies par les Indicateurs du développement dans le monde de la Banque mondiale, extraction du 13 juillet 2026.How to citeComment citer
Participation rate, 15+, %Taux d’activité, 15 ans et +, %
Employment to population, 15+, %Ratio emploi-population, 15 ans et +, %
2000
3.23,2
—
—
—
72.572,5
70.270,2
2005
2.92,9
—
—
—
72.672,6
70.470,4
2010
4.14,1
—
—
—
68.068,0
65.265,2
2015
4.44,4
—
—
8.28,2
65.365,3
62.462,4
2019
4.64,6
5.55,5
3.73,7
8.28,2
64.364,3
61.361,3
2020
5.45,4
6.56,5
4.24,2
9.69,6
63.463,4
60.060,0
2021
5.35,3
6.36,3
4.24,2
9.29,2
63.663,6
60.360,3
2022
4.54,5
5.45,4
3.73,7
8.18,1
64.464,4
61.461,4
2023
4.54,5
5.35,3
3.63,6
8.08,0
64.464,4
61.561,5
2024
4.44,4
5.25,2
3.63,6
8.08,0
64.464,4
61.661,6
2025
4.44,4
5.35,3
3.53,5
7.87,8
64.364,3
61.561,5
A four per cent unemployment rate in a country where four people in five are poor is not a paradox, it is a definition. A person counted as unemployed must have no work at all, be available for work and be looking for it; in an economy without unemployment insurance nobody can hold that position for long, so the poor are not unemployed, they are employed badly. The table that follows on the structure of employment is therefore the one to read beside this one, and the rate above should be read as a measure of the formal labour market rather than of hardship. Two further cautions. These are modelled estimates: the Labour Organization has only three survey readings for the DRC, 2005, 2012 and 2020, and interpolates the rest, so the year-to-year movement carries little information. And the figures for 2024 and 2025 are projections. The one economically meaningful movement in the table is the fall of the participation rate, from 72.5 per cent in 2000 to 64.3 in 2025: the population of working age has grown faster than the number of people at work.Un taux de chômage de quatre pour cent dans un pays où quatre personnes sur cinq sont pauvres n’est pas un paradoxe, c’est une définition. Est compté comme chômeur celui qui n’a aucun travail, qui est disponible et qui en cherche un ; dans une économie sans assurance chômage, personne ne tient longtemps cette position, de sorte que les pauvres ne sont pas chômeurs, ils sont mal employés. Le tableau suivant, sur la structure de l’emploi, se lit donc à côté de celui-ci, et le taux ci-dessus se lit comme une mesure du marché du travail formel plutôt que de la difficulté de vivre. Deux autres précautions. Ce sont des estimations modélisées : l’Organisation du travail ne dispose pour la RD Congo que de trois relevés d’enquête, 2005, 2012 et 2020, et interpole le reste, si bien que le mouvement d’une année à l’autre ne porte presque aucune information. Les chiffres de 2024 et de 2025 sont en outre des projections. Le seul mouvement économiquement parlant du tableau est la baisse du taux d’activité, de 72,5 pour cent en 2000 à 64,3 en 2025 : la population en âge de travailler a crû plus vite que le nombre de personnes au travail.
Source:Source : Organisation internationale du travail, estimations modélisées (ILO modelled estimates), servies par les Indicateurs du développement dans le monde de la Banque mondiale, extraction du 13 juillet 2026.
Table compiled by James Wabenga Yango.Tableau composé par James Wabenga Yango.How to citeComment citer
The structure of employmentLa structure de l’emploi
Figure by James Wabenga Yango. Source: Organisation internationale du travail, estimations modélisées (ILO modelled estimates), servies par les Indicateurs du développement dans le monde de la Banque mondiale, extraction du 13 juillet 2026.Figure de James Wabenga Yango. Source : Organisation internationale du travail, estimations modélisées (ILO modelled estimates), servies par les Indicateurs du développement dans le monde de la Banque mondiale, extraction du 13 juillet 2026.How to citeComment citer
This is the table that explains the previous one. Eight workers in ten are in vulnerable employment, that is own-account work or unpaid family work, and the proportion has not moved in a quarter of a century. Informal employment, measured on the international definition of the thirteenth conference of labour statisticians, was 96.3 per cent in 2020, against 98.6 in 2005: a fall of two points in fifteen years. Informality is measured only in a survey year, hence the dashes; the three readings come from the surveys of 2005, 2012 and 2020 and are not modelled. Agriculture has given up eight points since 2000, and services have taken all of them: industry, mining included, has employed a steady eight per cent of workers throughout, while producing the near totality of exports. That contrast is the single most important fact about the Congolese labour market.C’est ce tableau qui explique le précédent. Huit travailleurs sur dix sont en emploi vulnérable, c’est-à-dire à leur compte ou aides familiaux non rémunérés, et la proportion n’a pas bougé en un quart de siècle. L’emploi informel, mesuré selon la définition internationale de la treizième conférence des statisticiens du travail, était de 96,3 pour cent en 2020 contre 98,6 en 2005 : deux points en quinze ans. L’informalité n’est mesurée qu’une année d’enquête, d’où les tirets ; les trois relevés viennent des enquêtes de 2005, 2012 et 2020 et ne sont pas modélisés. L’agriculture a cédé huit points depuis 2000 et les services les ont tous pris : l’industrie, mines comprises, occupe invariablement huit pour cent des travailleurs tout en produisant la quasi-totalité des exportations. Ce contraste est le fait le plus important du marché du travail congolais.
Source:Source : Organisation internationale du travail, estimations modélisées (ILO modelled estimates), servies par les Indicateurs du développement dans le monde de la Banque mondiale, extraction du 13 juillet 2026.
Table compiled by James Wabenga Yango.Tableau composé par James Wabenga Yango.How to citeComment citer
What the Congolese surveys measuredCe que les enquêtes congolaises ont mesuré
Figure by James Wabenga Yango. Source: Institut national de la statistique, enquête 1-2-3, phase 1 de 2005 et phase 1 de 2012 ; résultats publiés par DIAL, documents de travail 2007-14 et 2014-23. Les microdonnées sont déposées au catalogue de l’International Household Survey Network (enquête 4076, 2004-2005), dans la bibliothèque d’enquêtes de l’Organisation internationale du travail (enquête 7795, 2012) et sur la page « Enquête 1-2-3 (2005 & 2012) » du Centre des grands lacs d’Afrique de l’université d’Anvers. Institut national de la statistique, Enquête sur les conditions de vie des ménages 2024, rapport final publié le 16 février 2026 avec le PNUD ; les deux lignes de 2024 sont reprises de la presse citant ce rapport, le fichier ne se laissant pas lire par machine.Figure de James Wabenga Yango. Source : Institut national de la statistique, enquête 1-2-3, phase 1 de 2005 et phase 1 de 2012 ; résultats publiés par DIAL, documents de travail 2007-14 et 2014-23. Les microdonnées sont déposées au catalogue de l’International Household Survey Network (enquête 4076, 2004-2005), dans la bibliothèque d’enquêtes de l’Organisation internationale du travail (enquête 7795, 2012) et sur la page « Enquête 1-2-3 (2005 & 2012) » du Centre des grands lacs d’Afrique de l’université d’Anvers. Institut national de la statistique, Enquête sur les conditions de vie des ménages 2024, rapport final publié le 16 février 2026 avec le PNUD ; les deux lignes de 2024 sont reprises de la presse citant ce rapport, le fichier ne se laissant pas lire par machine.How to citeComment citer
Three surveys in twenty years, and they say what the modelled estimates cannot. Unemployment is a town phenomenon and above all a Kinshasa one: 18.8 per cent in the capital in 2012 against 1.4 per cent in the countryside, because a rural household cannot afford to be without work and simply works its land. The broad definition, which counts those who want work but have stopped looking, is nearly twice the narrow one. The two 2024 readings are of a different kind, an employment rate rather than an unemployment rate, and the two should not be subtracted from one hundred to obtain each other: a person neither employed nor looking is inactive, not unemployed. They are also the only lines here taken from press accounts of the report rather than from the report itself, which no machine could read, and they are marked as such in the source.Trois enquêtes en vingt ans, et elles disent ce que les estimations modélisées ne peuvent pas dire. Le chômage est un phénomène urbain et surtout kinois : 18,8 pour cent dans la capitale en 2012 contre 1,4 pour cent en milieu rural, parce qu’un ménage rural ne peut pas se permettre d’être sans travail et cultive sa terre. Le chômage élargi, qui compte ceux qui veulent un emploi mais ont cessé d’en chercher, vaut près du double du chômage strict. Les deux relevés de 2024 sont d’une autre nature, un taux d’occupation et non un taux de chômage, et l’on ne passe pas de l’un à l’autre en retranchant de cent : une personne ni occupée ni en recherche est inactive, non chômeuse. Ce sont aussi les deux seules lignes tirées de comptes rendus de presse du rapport plutôt que du rapport lui-même, qu’aucune machine n’a pu lire, et la source le dit.
Source:Source : Institut national de la statistique, enquête 1-2-3, phase 1 de 2005 et phase 1 de 2012 ; résultats publiés par DIAL, documents de travail 2007-14 et 2014-23. Les microdonnées sont déposées au catalogue de l’International Household Survey Network (enquête 4076, 2004-2005), dans la bibliothèque d’enquêtes de l’Organisation internationale du travail (enquête 7795, 2012) et sur la page « Enquête 1-2-3 (2005 & 2012) » du Centre des grands lacs d’Afrique de l’université d’Anvers. Institut national de la statistique, Enquête sur les conditions de vie des ménages 2024, rapport final publié le 16 février 2026 avec le PNUD ; les deux lignes de 2024 sont reprises de la presse citant ce rapport, le fichier ne se laissant pas lire par machine.
Table compiled by James Wabenga Yango.Tableau composé par James Wabenga Yango.How to citeComment citer
Labour productivity, levelProductivité du travail, niveau
Figure by James Wabenga Yango. Source: Calcul de l’auteur à partir des Indicateurs du développement dans le monde (Banque mondiale, extraction du 13 juillet 2026) et des estimations modélisées de l’Organisation internationale du travail. Méthode et hypothèses sous le tableau.Figure de James Wabenga Yango. Source : Calcul de l’auteur à partir des Indicateurs du développement dans le monde (Banque mondiale, extraction du 13 juillet 2026) et des estimations modélisées de l’Organisation internationale du travail. Méthode et hypothèses sous le tableau.How to citeComment citer
GDP, billions of 2015 dollarsPIB, milliards de dollars de 2015
GDP per worker, 2015 dollarsPIB par travailleur, dollars de 2015
Index, 2000 = 100Indice, 2000 = 100
Capital to output ratioRapport capital-produit
2000
19.2619,26
17.117,1
891891
100.0100,0
2.112,11
2005
22.4122,41
20.720,7
923923
103.6103,6
2.032,03
2010
24.1124,11
27.727,7
1,1481 148
128.9128,9
2.172,17
2015
27.3127,31
40.240,2
1,4711 471
165.2165,2
2.252,25
2019
30.8030,80
44.844,8
1,4561 456
163.5163,5
2.522,52
2020
31.0931,09
45.245,2
1,4541 454
163.2163,2
2.572,57
2021
32.2132,21
48.148,1
1,4941 494
167.7167,7
2.662,66
2022
33.9033,90
52.652,6
1,5511 551
174.2174,2
2.722,72
2023
35.0935,09
57.157,1
1,6271 627
182.7182,7
2.742,74
2024
36.3136,31
60.660,6
1,6681 668
187.3187,3
2.822,82
2025
37.4837,48
64.064,0
1,7091 709
191.9191,9
2.822,82
Labour productivity is output divided by the number of people at work, and it is the quantity that decides, in the long run, what a country can pay itself. Employment is not published for the DRC and is obtained here as the labour force multiplied by one minus the unemployment rate; output is gross domestic product at constant 2015 dollars. The capital stock behind the last column is built by perpetual inventory from gross fixed capital formation at constant prices, with a depreciation rate of six per cent a year and an initial stock for 1993 set at investment divided by the sum of depreciation and the average growth rate of output over the period. The story is a doubling in twenty-five years, from 891 to 1 709 dollars a worker, and a productivity that stalled between 2015 and 2020 before starting again. The capital to output ratio rose from 2.1 to 2.8 over the same years, which means the additional output was bought with more capital per unit of product, not with better use of it.La productivité du travail est la production divisée par le nombre de personnes au travail, et c’est elle qui décide, à long terme, de ce qu’un pays peut se payer. L’emploi n’est pas publié pour la RD Congo : il est obtenu ici comme la population active multipliée par un moins le taux de chômage ; la production est le produit intérieur brut en dollars constants de 2015. Le stock de capital de la dernière colonne est construit par inventaire permanent à partir de la formation brute de capital fixe à prix constants, avec un taux de dépréciation de six pour cent l’an et un stock initial de 1993 posé égal à l’investissement divisé par la somme de la dépréciation et de la croissance moyenne de la production sur la période. L’histoire est celle d’un doublement en vingt-cinq ans, de 891 à 1 709 dollars par travailleur, et d’une productivité arrêtée entre 2015 et 2020 avant de repartir. Le rapport capital-produit est passé de 2,1 à 2,8 sur les mêmes années : la production supplémentaire a été achetée avec plus de capital par unité de produit, non avec un meilleur usage de celui-ci.
Source:Source : Calcul de l’auteur à partir des Indicateurs du développement dans le monde (Banque mondiale, extraction du 13 juillet 2026) et des estimations modélisées de l’Organisation internationale du travail. Méthode et hypothèses sous le tableau.
Table compiled by James Wabenga Yango.Tableau composé par James Wabenga Yango.How to citeComment citer
Growth of output, employment and productivityCroissance de la production, de l’emploi et de la productivité
Figure by James Wabenga Yango. Source: Calcul de l’auteur à partir des Indicateurs du développement dans le monde (Banque mondiale, extraction du 13 juillet 2026) et des estimations modélisées de l’Organisation internationale du travail. Méthode et hypothèses sous le tableau.Figure de James Wabenga Yango. Source : Calcul de l’auteur à partir des Indicateurs du développement dans le monde (Banque mondiale, extraction du 13 juillet 2026) et des estimations modélisées de l’Organisation internationale du travail. Méthode et hypothèses sous le tableau.How to citeComment citer
Output grew at 5.4 per cent a year over the quarter century, and productivity at 2.6: half of Congolese growth is the arrival of new workers, not a gain in what each one produces. The gap between the first column and the last is demography. Output per head grew at 2.1 per cent a year while output grew at 5.4, because the population grew at more than three per cent. This is the arithmetic that decides how long it takes to leave poverty: at 2.1 per cent a year, output per head doubles in thirty-three years; at 4 per cent, in eighteen.La production a crû de 5,4 pour cent l’an sur le quart de siècle, et la productivité de 2,6 : la moitié de la croissance congolaise est l’arrivée de travailleurs nouveaux, non un gain de ce que chacun produit. L’écart entre la première colonne et la dernière est la démographie. La production par habitant a crû de 2,1 pour cent l’an quand la production croissait de 5,4, parce que la population croissait de plus de trois pour cent. C’est cette arithmétique qui décide du temps qu’il faut pour sortir de la pauvreté : à 2,1 pour cent l’an, le produit par habitant double en trente-trois ans ; à 4 pour cent, en dix-huit.
Source:Source : Calcul de l’auteur à partir des Indicateurs du développement dans le monde (Banque mondiale, extraction du 13 juillet 2026) et des estimations modélisées de l’Organisation internationale du travail. Méthode et hypothèses sous le tableau.
Table compiled by James Wabenga Yango.Tableau composé par James Wabenga Yango.How to citeComment citer
Growth accounting, contributions to output growthComptabilité de la croissance, contributions à la croissance de la production
Figure by James Wabenga Yango. Source: Calcul de l’auteur à partir des Indicateurs du développement dans le monde (Banque mondiale, extraction du 13 juillet 2026) et des estimations modélisées de l’Organisation internationale du travail. Méthode et hypothèses sous le tableau.Figure de James Wabenga Yango. Source : Calcul de l’auteur à partir des Indicateurs du développement dans le monde (Banque mondiale, extraction du 13 juillet 2026) et des estimations modélisées de l’Organisation internationale du travail. Méthode et hypothèses sous le tableau.How to citeComment citer
Total factor productivityProductivité globale des facteurs
Share of growth from productivity, %Part de la croissance due à la productivité, %
2000-2010
4.904,90
2.082,08
1.361,36
1.461,46
3030
2010-2019
5.515,51
2.912,91
1.651,65
0.950,95
1717
2019-2025
6.126,12
3.253,25
2.002,00
0.870,87
1414
2000-2025
5.415,41
2.662,66
1.621,62
1.141,14
2121
The decomposition is the standard one. Output is written as a Cobb-Douglas function of capital and labour, growth of output is then the capital share times growth of capital, plus the labour share times growth of labour, plus a residual which is total factor productivity. The capital share is set at 0.40, a usual value for a capital-intensive extractive economy; with 0.33 instead, total factor productivity rises to 1.40 points a year over 2000-2025 and to 26 per cent of growth, so the reading below does not depend on the choice. The reading is this: Congolese growth is increasingly bought with capital. The residual, which measures everything that is neither machine nor worker, such as organisation, roads, the rule of law and technical progress, contributed 1.5 points a year in the 2000s and 0.9 in the 2020s, and its share of growth fell from thirty to fourteen per cent. A growth of that shape is expensive and it is fragile, because it lasts only as long as the investment lasts.La décomposition est la décomposition usuelle. La production s’écrit comme une fonction Cobb-Douglas du capital et du travail ; la croissance de la production est alors la part du capital fois la croissance du capital, plus la part du travail fois la croissance du travail, plus un résidu qui est la productivité globale des facteurs. La part du capital est posée à 0,40, valeur usuelle pour une économie extractive intensive en capital ; avec 0,33, la productivité globale des facteurs remonte à 1,40 point l’an sur 2000-2025 et à 26 pour cent de la croissance : la lecture ci-dessous ne tient donc pas au choix de ce paramètre. Cette lecture est la suivante. La croissance congolaise s’achète de plus en plus avec du capital. Le résidu, qui mesure tout ce qui n’est ni machine ni travailleur, comme l’organisation, les routes, l’État de droit et le progrès technique, a apporté 1,5 point l’an dans les années 2000 et 0,9 dans les années 2020, et sa part dans la croissance est tombée de trente à quatorze pour cent. Une croissance de cette forme coûte cher et elle est fragile, car elle ne dure que ce que dure l’investissement.
Source:Source : Calcul de l’auteur à partir des Indicateurs du développement dans le monde (Banque mondiale, extraction du 13 juillet 2026) et des estimations modélisées de l’Organisation internationale du travail. Méthode et hypothèses sous le tableau.
Table compiled by James Wabenga Yango.Tableau composé par James Wabenga Yango.How to citeComment citer
Output per head, and what it is made ofLe produit par habitant, et ce qui le compose
Figure by James Wabenga Yango. Source: Calcul de l’auteur à partir des Indicateurs du développement dans le monde (Banque mondiale, extraction du 13 juillet 2026) et des estimations modélisées de l’Organisation internationale du travail. Méthode et hypothèses sous le tableau.Figure de James Wabenga Yango. Source : Calcul de l’auteur à partir des Indicateurs du développement dans le monde (Banque mondiale, extraction du 13 juillet 2026) et des estimations modélisées de l’Organisation internationale du travail. Méthode et hypothèses sous le tableau.How to citeComment citer
GDP per head, 2015 dollarsPIB par habitant, dollars de 2015
Productivity, dollars per workerProductivité, dollars par travailleur
Employment rate, 15-64Taux d’emploi, 15-64 ans
Share of population aged 15-64Part des 15-64 ans dans la population
2000
339.5339,5
891891
0.7420,742
0.5140,514
2010
403.7403,7
1,1481 148
0.6920,692
0.5080,508
2019
482.5482,5
1,4561 456
0.6510,651
0.5090,509
2025
567.6567,6
1,7091 709
0.6520,652
0.5100,510
Output per head is the product of three things: what a worker produces, the share of working-age people who work, and the share of the population that is of working age. Written in growth rates the product becomes a sum, and the last line of the table is that sum: 2.08 = 2.64 − 0.52 − 0.03. Productivity did all the work, and the employment rate took back a fifth of it, because employment grew more slowly than the working-age population. The third term is almost exactly zero, and that is the notable fact: the share of people of working age has not moved in twenty-five years, so the DRC has not yet entered the demographic transition that gave Asia its extra points of growth. The 2025 figures are projections.Le produit par habitant est le produit de trois choses : ce que produit un travailleur, la part des personnes en âge de travailler qui travaillent, et la part de la population qui est en âge de travailler. Écrit en taux de croissance, le produit devient une somme, et la dernière ligne du tableau est cette somme : 2,08 = 2,64 − 0,52 − 0,03. La productivité a tout fait, et le taux d’emploi en a repris un cinquième, l’emploi ayant crû moins vite que la population en âge de travailler. Le troisième terme est presque exactement nul, et c’est le fait notable : la part des personnes en âge de travailler n’a pas bougé en vingt-cinq ans, de sorte que la RD Congo n’est pas encore entrée dans la transition démographique qui a donné à l’Asie ses points de croissance supplémentaires. Les chiffres de 2025 sont des projections.
Source:Source : Calcul de l’auteur à partir des Indicateurs du développement dans le monde (Banque mondiale, extraction du 13 juillet 2026) et des estimations modélisées de l’Organisation internationale du travail. Méthode et hypothèses sous le tableau.
Table compiled by James Wabenga Yango.Tableau composé par James Wabenga Yango.How to citeComment citer
Output per head, contributions to growthLe produit par habitant, contributions à la croissance
Figure by James Wabenga Yango. Source: Calcul de l’auteur à partir des Indicateurs du développement dans le monde (Banque mondiale, extraction du 13 juillet 2026) et des estimations modélisées de l’Organisation internationale du travail. Méthode et hypothèses sous le tableau.Figure de James Wabenga Yango. Source : Calcul de l’auteur à partir des Indicateurs du développement dans le monde (Banque mondiale, extraction du 13 juillet 2026) et des estimations modélisées de l’Organisation internationale du travail. Méthode et hypothèses sous le tableau.How to citeComment citer
Each line is a sum: the growth of output per head equals the growth of productivity, plus the growth of the employment rate, plus the growth of the share of the population of working age. The middle column carries everything; the third is negative until 2019, because employment grew more slowly than the working-age population; the fourth is zero throughout, the demographic transition not having begun.Chaque ligne est une somme : la croissance du produit par habitant égale la croissance de la productivité, plus celle du taux d’emploi, plus celle de la part de la population en âge de travailler. La colonne du milieu porte tout ; la troisième est négative jusqu’en 2019, l’emploi ayant crû moins vite que la population en âge de travailler ; la quatrième est nulle d’un bout à l’autre, la transition démographique n’ayant pas commencé.
Source:Source : Calcul de l’auteur à partir des Indicateurs du développement dans le monde (Banque mondiale, extraction du 13 juillet 2026) et des estimations modélisées de l’Organisation internationale du travail. Méthode et hypothèses sous le tableau.
Table compiled by James Wabenga Yango.Tableau composé par James Wabenga Yango.How to citeComment citer
Output per worker, international comparisonProduction par travailleur, comparaison internationale
Figure by James Wabenga Yango. Source: Banque mondiale, Indicateurs du développement dans le monde, indicateur SL.GDP.PCAP.EM.KD, PIB par personne employée en parités de pouvoir d’achat constantes de 2021, extraction du 13 juillet 2026.Figure de James Wabenga Yango. Source : Banque mondiale, Indicateurs du développement dans le monde, indicateur SL.GDP.PCAP.EM.KD, PIB par personne employée en parités de pouvoir d’achat constantes de 2021, extraction du 13 juillet 2026.How to citeComment citer
The same quantity as the first table of this section, but measured in purchasing power parities so that countries can be compared, which is why the level differs from the one in 2015 dollars. A Congolese worker produces 4 939 international dollars a year, a Rwandan twice that, the average sub-Saharan worker two and a half times, an Ivorian three and a half. The gap with the regional average has not closed: it was 2.8 to 1 in 2022 and it is 2.6 to 1 in 2025, a convergence that would take two generations at that pace. The 2025 column is a projection.La même grandeur que dans le premier tableau de cette section, mais mesurée en parités de pouvoir d’achat pour que les pays se comparent, d’où un niveau différent de celui exprimé en dollars de 2015. Un travailleur congolais produit 4 939 dollars internationaux par an, un Rwandais le double, le travailleur subsaharien moyen deux fois et demie, un Ivoirien trois fois et demie. L’écart avec la moyenne régionale ne s’est pas refermé : il était de 2,8 contre 1 en 2022, il est de 2,6 contre 1 en 2025, une convergence qui demanderait deux générations à ce rythme. La colonne de 2025 est une projection.
Source:Source : Banque mondiale, Indicateurs du développement dans le monde, indicateur SL.GDP.PCAP.EM.KD, PIB par personne employée en parités de pouvoir d’achat constantes de 2021, extraction du 13 juillet 2026.
Table compiled by James Wabenga Yango.Tableau composé par James Wabenga Yango.How to citeComment citer
The state of the Congolese economy, September 2026L’état de l’économie congolaise, septembre 2026
This pane carries a single document: a quantitative report on the economic situation of the country, typeset in LaTeX and downloadable as a PDF. It assembles what the other panes hold table by table (growth, inflation and the exchange rate, the external accounts, the public finances, commodity prices, employment and productivity, poverty) into one continuous argument, with its own figures and its own appendix on method. The table below is the frame of that argument; the document develops it.
Ce volet porte un seul document : un rapport quantitatif sur la situation économique du pays, composé en LaTeX et téléchargeable en PDF. Il rassemble ce que les autres volets tiennent tableau par tableau (croissance, inflation et taux de change, comptes extérieurs, finances publiques, prix des matières premières, emploi et productivité, pauvreté) en un raisonnement continu, avec ses propres figures et son annexe de méthode. Le tableau ci-dessous est le cadre de ce raisonnement ; le document le développe.
Economic situation of the Democratic Republic of the CongoSituation économique de la République démocratique du Congo
Figure by James Wabenga Yango. Source: Banque mondiale, Macro Poverty Outlook, édition d’avril 2026, fiche République démocratique du Congo ; seuils de pauvreté en parités de pouvoir d’achat de 2021.Figure de James Wabenga Yango. Source : Banque mondiale, Macro Poverty Outlook, édition d’avril 2026, fiche République démocratique du Congo ; seuils de pauvreté en parités de pouvoir d’achat de 2021.How to citeComment citer
Inflation, consumer prices, %Inflation, prix à la consommation, %
19.919,9
17.717,7
7.57,5
6.06,0
6.46,4
7.07,0
Current account balance, % of GDPSolde courant, % du PIB
-5.5-5,5
-4.2-4,2
-3.6-3,6
-3.4-3,4
-3.2-3,2
-3.0-3,0
Fiscal balance, % of GDPSolde budgétaire, % du PIB
-2.4-2,4
-2.4-2,4
-3.2-3,2
-2.6-2,6
-2.6-2,6
-1.8-1,8
Public debt, % of GDPDette publique, % du PIB
27.427,4
22.922,9
21.121,1
21.621,6
21.821,8
22.122,1
Poverty at $3.00 a day, %Pauvreté à 3,00 USD par jour, %
82.482,4
81.781,7
81.181,1
80.680,6
80.180,1
79.579,5
Six lines are enough to state the Congolese position. Growth is strong and slowing to about five per cent, inflation has been brought down from twenty to six, the external and fiscal deficits are small, public debt is low at about twenty-two per cent of output, and poverty does not move. The first five lines describe a country whose macroeconomic management has worked; the sixth says that this is not, by itself, enough. Everything from 2025 onwards is a forecast, and the forecast assumes no worsening of the war in the east and no collapse of the copper and cobalt prices.Six lignes suffisent à dire la position congolaise. La croissance est forte et ralentit vers cinq pour cent, l’inflation a été ramenée de vingt à six, les déficits extérieur et budgétaire sont petits, la dette publique est basse, autour de vingt-deux pour cent de la production, et la pauvreté ne bouge pas. Les cinq premières lignes décrivent un pays dont la gestion macroéconomique a fonctionné ; la sixième dit que cela ne suffit pas en soi. Tout ce qui va de 2025 à 2028 est une prévision, et cette prévision suppose que la guerre de l’Est ne s’aggrave pas et que les cours du cuivre et du cobalt ne s’effondrent pas.
Source:Source : Banque mondiale, Macro Poverty Outlook, édition d’avril 2026, fiche République démocratique du Congo ; seuils de pauvreté en parités de pouvoir d’achat de 2021.
Table compiled by James Wabenga Yango.Tableau composé par James Wabenga Yango.How to citeComment citer
Displacement, refuge and the age structureDéplacements, refuge et structure par âge
An economist has no business treating armed conflict as an exogenous shock in a country where it has been continuous for thirty years. It belongs in the accounts. Displacement removes labour from where it was productive and rarely returns it, and the age structure sets how fast output must grow before income per head moves at all. Every count below is what a named body was able to document, and none of them is a total. The distinction matters more here than anywhere else on this page.
Un économiste n’a pas à traiter le conflit armé comme un choc exogène dans un pays où il dure depuis trente ans. Il relève des comptes. Le déplacement retire de la main-d’œuvre à l’endroit où elle était productive et l’y ramène rarement, et la structure par âge fixe la vitesse à laquelle la production doit croître avant que le revenu par tête ne bouge. Chaque décompte ci-dessous est ce qu’un organisme nommé a pu documenter, et aucun n’est un total. La distinction importe ici plus que partout ailleurs sur cette page.
Figure by James Wabenga Yango. Source: OIM, Matrice de suivi des déplacements, aperçu des déplacements internes 2026 ; OCHA, relevés 2021-2026. HCR, Global Appeal 2026, chapitre RD Congo, janvier 2026.Figure de James Wabenga Yango. Source : OIM, Matrice de suivi des déplacements, aperçu des déplacements internes 2026 ; OCHA, relevés 2021-2026. HCR, Global Appeal 2026, chapitre RD Congo, janvier 2026.How to citeComment citer
November 2025 to February 2026Novembre 2025 à février 2026
5.655,65
Four eastern provincesQuatre provinces de l’Est
IOM displacement tracking matrixMatrice de suivi des déplacements de l’OIM
13 April 202613 avril 2026
5.615,61
NationalNational
OCHA and IOMOCHA et OIM
These readings are not a series and must not be differenced. Coverage, method and reporting body change between vintages, and the drop from 7.8 million at the end of 2024 to 5.6 million in 2026 reflects those changes as much as any return movement. The eastern reading of November 2025 to February 2026 covers four provinces only and counts 5,647,465 displaced alongside 3,525,590 returnees. Total forced displacement, internal and external together, was put at 8.2 million in September 2025.Ces relevés ne forment pas une série et ne se différencient pas. Le périmètre, la méthode et l’organisme changent d’un millésime à l’autre, et la baisse de 7,8 millions fin 2024 à 5,6 millions en 2026 tient à ces changements autant qu’à des retours. Le relevé oriental de novembre 2025 à février 2026 ne couvre que quatre provinces et dénombre 5 647 465 déplacés à côté de 3 525 590 retournés. Le déplacement forcé total, interne et externe confondus, était évalué à 8,2 millions en septembre 2025.
Source:Source : OIM, Matrice de suivi des déplacements, aperçu des déplacements internes 2026 ; OCHA, relevés 2021-2026. HCR, Global Appeal 2026, chapitre RD Congo, janvier 2026.
Table compiled by James Wabenga Yango.Tableau composé par James Wabenga Yango.How to citeComment citer
Displacement by province, eastern DR CongoDéplacements par province, est de la RD Congo
Figure by James Wabenga Yango. Source: OIM, Matrice de suivi des déplacements, aperçu des déplacements internes 2026 ; OCHA, relevés 2021-2026.Figure de James Wabenga Yango. Source : OIM, Matrice de suivi des déplacements, aperçu des déplacements internes 2026 ; OCHA, relevés 2021-2026.How to citeComment citer
Share of the four provinces, %Part des quatre provinces, %
Nord-Kivu
2,561,1362 561 136
4545
Sud-Kivu
1,395,6041 395 604
2525
Ituri
1,360,5771 360 577
2424
Tanganyika
330,148330 148
66
The reading covers November 2025 to February 2026 and counts displacement inside and between these four provinces; 3,525,590 returnees were recorded over the same round. Nearly half of the displaced are in North Kivu alone. Set against the population table in the Population tab, the displaced amount to a quarter of the inhabitants of North Kivu and a fifth of those of Ituri.Le relevé porte sur novembre 2025 à février 2026 et dénombre les déplacements à l’intérieur de ces quatre provinces et entre elles ; 3 525 590 retournés ont été enregistrés sur le même tour. Près de la moitié des déplacés se trouvent dans le seul Nord-Kivu. Rapportés au tableau de population de l’onglet Population, les déplacés représentent le quart des habitants du Nord-Kivu et le cinquième de ceux de l’Ituri.
Source:Source : OIM, Matrice de suivi des déplacements, aperçu des déplacements internes 2026 ; OCHA, relevés 2021-2026.
Table compiled by James Wabenga Yango.Tableau composé par James Wabenga Yango.How to citeComment citer
Refugees and asylum seekersRéfugiés et demandeurs d’asile
Figure by James Wabenga Yango. Source: HCR, Global Appeal 2026, chapitre RD Congo, janvier 2026.Figure de James Wabenga Yango. Source : HCR, Global Appeal 2026, chapitre RD Congo, janvier 2026.How to citeComment citer
Congolese refugees and asylum seekers abroadRéfugiés et demandeurs d’asile congolais à l’étranger
1,200,0001 200 000
30 November 202530 novembre 2025
New arrivals in the five neighbouring countries since early 2025Arrivées nouvelles dans les cinq pays voisins depuis début 2025
127,000127 000
2025
Refugees and asylum seekers hosted in the DR CongoRéfugiés et demandeurs d’asile accueillis en RD Congo
529,000529 000
2025
Total forcibly displaced, internal and externalDéplacement forcé total, interne et externe
8,200,0008 200 000
September 2025Septembre 2025
Roughly half of the Congolese refugee population is in Uganda, and more than two fifths of those the DRC itself hosts are Rwandan. The agency’s own materials give the hosted caseload as both 529,000 and 490,000 in the same publication; the larger figure is used here and the discrepancy noted rather than resolved. The agency projects nine million forcibly displaced by the end of 2026.La moitié environ des réfugiés congolais se trouve en Ouganda, et plus des deux cinquièmes de ceux que la RD Congo accueille elle-même sont rwandais. Les documents de l’agence donnent l’effectif accueilli à la fois à 529 000 et à 490 000 dans la même publication ; le chiffre le plus élevé est retenu ici et la divergence signalée plutôt que tranchée. L’agence projette neuf millions de déplacés forcés à la fin de 2026.
Source:Source : HCR, Global Appeal 2026, chapitre RD Congo, janvier 2026.
Table compiled by James Wabenga Yango.Tableau composé par James Wabenga Yango.How to citeComment citer
Documented human rights violationsViolations documentées des droits de l’homme
PeriodPériode
Violations documentedViolations documentées
Victims documentedVictimes documentées
ScopePérimètre
2022
5,0915 091
—
Five conflict-affected provincesCinq provinces en conflit
2023
5,2735 273
—
NationalNational
First half of 2024Premier semestre 2024
2,3552 355
6,3096 309
NationalNational
2025
6,1696 169
18,00018 000
NationalNational
Every figure here is a count of what the United Nations joint human rights office was able to document and verify, not an estimate of what occurred; the true figures are higher by an unknown margin, and the office says so. The 2022 line covers five provinces and is not comparable with the national counts. The 2025 total is a floor: within it the office documented 1,479 victims of conflict-related sexual violence, up by three fifths on the previous year, and more than 3,900 victims of extrajudicial execution, of whom nearly three hundred were children. Armed groups were held responsible for 71 per cent of violations and state agents for 28 per cent.Chaque chiffre est ici un décompte de ce que le bureau conjoint des Nations unies aux droits de l’homme a pu documenter et vérifier, non une estimation de ce qui est survenu ; les chiffres réels sont supérieurs d’une marge inconnue, et le bureau le dit. La ligne de 2022 porte sur cinq provinces et ne se compare pas aux décomptes nationaux. Le total de 2025 est un plancher : le bureau y a documenté 1 479 victimes de violences sexuelles liées au conflit, en hausse de trois cinquièmes sur l’année précédente, et plus de 3 900 victimes d’exécution extrajudiciaire, dont près de trois cents enfants. Les groupes armés ont été tenus pour responsables de 71 pour cent des violations et les agents de l’État de 28 pour cent.
Source:Source : Bureau conjoint des Nations unies aux droits de l’homme, rapport annuel 2025, présenté à Kinshasa le 12 mars 2026.
Table compiled by James Wabenga Yango.Tableau composé par James Wabenga Yango.How to citeComment citer
PopulationDémographie
IndicatorIndicateur
ValueValeur
Reference yearAnnée de référence
SourceSource
Total populationPopulation totale
109,276,265.00109 276 265,00
2024
World BankBanque mondiale
Total populationPopulation totale
112,832,473.00112 832 473,00
2025
World BankBanque mondiale
Population growth, per cent a yearCroissance démographique, % par an
3.203,20
2025
World BankBanque mondiale
Crude birth rate, per thousandTaux brut de natalité, pour mille
41.3141,31
2023
World BankBanque mondiale
Crude birth rate, per thousandTaux brut de natalité, pour mille
40.8840,88
2024
World BankBanque mondiale
Net migrationSolde migratoire
-27,309.00-27 309,00
2025
World BankBanque mondiale
Total fertility rate, children per womanIndice synthétique de fécondité, enfants par femme
5.805,80
2024
UN population divisionDivision de la population des Nations unies
Median age, yearsÂge médian, années
15.9015,90
2024
UN population divisionDivision de la population des Nations unies
Urban share of the population, per centPart urbaine de la population, %
45.4045,40
2026
UN population divisionDivision de la population des Nations unies
GDP per capita, current $PIB par habitant, USD courants
806.80806,80
2025
World BankBanque mondiale
A median age of sixteen and a fertility rate near six put the DRC among the youngest populations on earth, and this is the demographic transition my third line of research takes as its object. The arithmetic that follows is unforgiving: at three per cent a year the population doubles in twenty-three years, so output must grow by more than three per cent merely to hold income per head still. Growth of five to six per cent, which the DRC has recorded, leaves two to three points of genuine convergence a year, and no more. The net migration figure is small enough relative to natural increase to be immaterial to that arithmetic. The birth rate is the only demographic series the World Bank tabulates cleanly for the country; the death rate is not published in a form that could be verified and is therefore absent.Un âge médian de seize ans et une fécondité proche de six placent la RD Congo parmi les populations les plus jeunes du monde, et c’est la transition démographique que prend pour objet mon troisième axe de recherche. L’arithmétique qui suit ne pardonne pas : à trois pour cent l’an, la population double en vingt-trois ans, de sorte que la production doit croître de plus de trois pour cent pour seulement maintenir le revenu par tête. Une croissance de cinq à six pour cent, celle qu’a enregistrée la RD Congo, laisse deux à trois points de convergence réelle par an, pas davantage. Le solde migratoire est assez faible au regard de l’accroissement naturel pour ne rien changer à ce calcul. Le taux de natalité est la seule série démographique que la Banque mondiale tabule proprement pour le pays ; le taux de mortalité n’est pas publié sous une forme vérifiable et manque donc.
Source:Source : Banque mondiale, World Development Indicators, fiche pays consultée en août 2026. Nations unies, Département des affaires économiques et sociales, World Population Prospects, révision 2024.
Table compiled by James Wabenga Yango.Tableau composé par James Wabenga Yango.How to citeComment citer
The seventeenth Ebola outbreak, and what stands behind itLa dix-septième épidémie d’Ebola, et ce qui se tient derrière
An epidemic is an economic event before it is anything else to an economist: it closes markets, empties health zones of the people who staffed them, diverts a budget that was thin to begin with, and does all of this in provinces that were already the poorest and the least accessible. The outbreak of Bundibugyo virus disease that began in Mongbwalu in May 2026 is now the largest Ebola outbreak the country has recorded, and it is still growing as this is written. The five tables below hold the surveillance record as published: how the outbreak has moved from one bulletin to the next, where it stands today, where it is, where it started, and how it compares with the sixteen that came before. A sixth table carries the other diseases under surveillance. Nothing here is modelled, projected or filled in. Where a figure has not been published, the cell carries a dash and the note says why, because for a reader in a ministry or a field office the difference between a zero and a silence is the whole difference.
Une épidémie est d’abord, pour un économiste, un événement économique : elle ferme des marchés, vide de leur personnel les zones de santé, détourne un budget qui était déjà mince, et fait tout cela dans les provinces les plus pauvres et les moins accessibles. L’épidémie de maladie à virus Bundibugyo partie de Mongbwalu en mai 2026 est aujourd’hui la plus étendue que le pays ait enregistrée, et elle croît encore à l’heure où ces lignes sont écrites. Les cinq tableaux ci-dessous portent le relevé de surveillance tel qu’il est publié : comment l’épidémie s’est déplacée d’un bulletin au suivant, où elle en est aujourd’hui, où elle se trouve, d’où elle est partie, et ce qu’elle vaut au regard des seize qui l’ont précédée. Un sixième tableau porte les autres maladies sous surveillance. Rien ici n’est modélisé, projeté ni comblé. Là où un chiffre n’a pas été publié, la case porte un tiret et la note dit pourquoi, car pour un lecteur en ministère ou en bureau de terrain la différence entre un zéro et un silence est toute la différence.
The outbreak bulletin by bulletin, as the World Health Organization reported itL’épidémie bulletin par bulletin, telle que l’Organisation mondiale de la santé l’a rapportée
Figure by James Wabenga Yango. Source: OMS, les douze bulletins d’épidémie de la série, 2026-DON602 du 16 mai 2026 à 2026-DON617 du 10 septembre 2026. Chaque ligne est citée du bulletin qui la porte ; aucune n’est calculée à partir d’une autre.Figure de James Wabenga Yango. Source : OMS, les douze bulletins d’épidémie de la série, 2026-DON602 du 16 mai 2026 à 2026-DON617 du 10 septembre 2026. Chaque ligne est citée du bulletin qui la porte ; aucune n’est calculée à partir d’une autre.How to citeComment citer
Case fatality ratio as printed, %Létalité telle qu’imprimée, %
RecoveredGuéris
2026-DON602
16 May 202616 mai 2026
15 May 202615 mai 2026
—
44
—
—
2026-DON603
21 May 202621 mai 2026
21 May 202621 mai 2026
8383
99
11.011,0
—
2026-DON605
29 May 202629 mai 2026
27 May 202627 mai 2026
125125
1717
14.014,0
—
2026-DON606
8 June 20268 juin 2026
6 June 20266 juin 2026
515515
9191
17.717,7
1212
2026-DON607
13 June 202613 juin 2026
10 June 202610 juin 2026
676676
136136
20.120,1
3232
2026-DON608
19 June 202619 juin 2026
17 June 202617 juin 2026
896896
232232
26.026,0
7878
2026-DON612
3 July 20263 juillet 2026
1 July 20261er juillet 2026
1,4601 460
452452
30.930,9
213213
2026-DON613
17 July 202617 juillet 2026
15 July 202615 juillet 2026
2,1242 124
828828
39.039,0
390390
2026-DON614
1 August 20261er août 2026
30 July 202630 juillet 2026
3,6053 605
1,5871 587
44.044,0
651651
2026-DON615
14 August 202614 août 2026
12 August 202612 août 2026
4,6654 665
2,1842 184
46.846,8
965965
2026-DON616
28 August 202628 août 2026
26 August 202626 août 2026
5,7945 794
2,7862 786
48.148,1
1,2931 293
2026-DON617
10 September 202610 septembre 2026
7 September 20267 septembre 2026
6,7576 757
3,2673 267
48.348,3
1,5901 590
This is the table that makes the outbreak legible as a movement rather than a snapshot: one line per bulletin, each figure taken from the bulletin that carries it. Nothing here is carried over from a neighbouring issue and nothing is computed. The case fatality ratio is quoted exactly as the World Health Organization prints it, which is why it does not always follow from the two columns beside it; the Organization revises its denominator as investigations close. The figures are for the DR Congo alone. The first bulletin states no confirmed total; it reports suspected cases, and the four deaths shown are the four it attributes to confirmed cases, so that cell carries a dash. The bulletins of 13 and 19 June both warn that their own ratio is probably an underestimate, because deaths that occurred before the outbreak was declared were still under investigation. The numbering has gaps because the Disease Outbreak News series is shared with other events; the twelve bulletins listed here are the whole of the series for this outbreak. The bulletin of 1 August was revised on 3 August, and it is the revised text that is quoted.C’est ce tableau qui rend l’épidémie lisible comme un mouvement et non comme un instantané : une ligne par bulletin, chaque chiffre pris dans le bulletin qui le porte. Rien n’est repris d’un numéro voisin, rien n’est calculé. La létalité est citée exactement comme l’Organisation mondiale de la santé l’imprime, ce qui explique qu’elle ne découle pas toujours des deux colonnes qui la précèdent : l’Organisation révise son dénominateur à mesure que les enquêtes se closent. Les chiffres portent sur la seule RD Congo. Le premier bulletin ne donne aucun total de cas confirmés ; il compte des cas suspects, et les quatre décès portés ici sont les quatre qu’il rattache à des cas confirmés, d’où le tiret. Les bulletins des 13 et 19 juin avertissent l’un et l’autre que leur propre taux est vraisemblablement sous-estimé, des décès survenus avant la déclaration de l’épidémie restant à instruire. La numérotation présente des trous parce que la série des bulletins d’épidémie est partagée avec d’autres événements ; les douze bulletins recensés ici sont toute la série de cette épidémie. Le bulletin du 1er août a été révisé le 3 août, et c’est le texte révisé qui est cité.
Source:Source : OMS, les douze bulletins d’épidémie de la série, 2026-DON602 du 16 mai 2026 à 2026-DON617 du 10 septembre 2026. Chaque ligne est citée du bulletin qui la porte ; aucune n’est calculée à partir d’une autre.
Table compiled by James Wabenga Yango.Tableau composé par James Wabenga Yango.How to citeComment citer
The seventeenth Ebola outbreak, latest readingLa dix-septième épidémie d’Ebola, dernier relevé
Figure by James Wabenga Yango. Source: OMS, bulletin d’épidémie 2026-DON617, « Maladie à virus Bundibugyo — République démocratique du Congo », 10 septembre 2026 ; chiffres arrêtés au 7 septembre 2026, sauf la vaccination, arrêtée au 6 septembre.Figure de James Wabenga Yango. Source : OMS, bulletin d’épidémie 2026-DON617, « Maladie à virus Bundibugyo — République démocratique du Congo », 10 septembre 2026 ; chiffres arrêtés au 7 septembre 2026, sauf la vaccination, arrêtée au 6 septembre.How to citeComment citer
Deaths among confirmed cases, DR CongoDécès parmi les cas confirmés, RD Congo
3,2673 267
crude case fatality ratio of 48.3 per centlétalité brute de 48,3 pour cent
Patients recovered, DR CongoPatients guéris, RD Congo
1,5901 590
as of 7 September 2026au 7 septembre 2026
Confirmed cases in the last twenty-four hoursCas confirmés des vingt-quatre dernières heures
7171
from 17 health zonesdans 17 zones de santé
Confirmed cases added since the bulletin of 28 AugustCas confirmés ajoutés depuis le bulletin du 28 août
963963
twelve daysdouze jours
Deaths added since the bulletin of 28 AugustDécès ajoutés depuis le bulletin du 28 août
481481
twelve daysdouze jours
Contacts to be followed upContacts à suivre
24,71924 719
in the twenty-four hours to 7 Septemberdans les vingt-quatre heures au 7 septembre
Contacts actually seenContacts effectivement vus
21,35921 359
85.3 per cent of those to be followed up85,3 pour cent des contacts à suivre
People vaccinatedPersonnes vaccinées
2,0072 007
in six health zones of three provinces, as of 6 Septemberdans six zones de santé de trois provinces, au 6 septembre
Provinces affectedProvinces touchées
66
Ituri, North Kivu, South Kivu, Haut-Uélé, Tshopo, Bas-UéléIturi, Nord-Kivu, Sud-Kivu, Haut-Uélé, Tshopo, Bas-Uélé
Health zones affectedZones de santé touchées
6161
since the outbreak begandepuis le début de l’épidémie
Health zones with a case in the last 21 daysZones de santé avec un cas dans les 21 derniers jours
5151
as of 7 September 2026au 7 septembre 2026
Confirmed cases, UgandaCas confirmés, Ouganda
2020
18 recovered18 guéris
Deaths, UgandaDécès, Ouganda
22
as of 7 September 2026au 7 septembre 2026
Confirmed cases, FranceCas confirmés, France
11
imported 24 June, discharged 4 July, no secondary transmissionimporté le 24 juin, sorti le 4 juillet, aucune transmission secondaire
Confirmed cases, all countriesCas confirmés, tous pays
6,7786 778
including two DR Congo cases treated in Germanydont deux cas congolais traités en Allemagne
Deaths, all countriesDécès, tous pays
3,2693 269
including two in Ugandadont deux en Ouganda
Patients recovered, all countriesPatients guéris, tous pays
1,6111 611
as of 7 September 2026au 7 septembre 2026
This outbreak is the largest ever recorded in the country: it has passed the outbreak of 2018 to 2020, which the World Health Organization counts at 3 317 confirmed cases, by more than double, and it is expanding faster than any previous Ebola outbreak there. It was declared on 15 May 2026 by the Ministry of Public Health, Hygiene and Social Welfare and was determined a public health emergency of international concern on 17 May. Three cautions belong with the figures. The Organization attributes part of the increase to strengthened surveillance and laboratory capacity, but says that most of it reflects the expansion of the outbreak itself. There is still no licensed vaccine and no specific treatment for the Bundibugyo virus: the 2 007 people vaccinated by 6 September received a product that is not approved for this virus, and the PARTNERS treatment trial had enrolled more than three hundred confirmed cases. And the bulletins of 28 August and 10 September no longer publish the count of infected health workers, which the bulletin of 14 August put at 155 at least, with 45 deaths, as of 9 August; those lines have been removed rather than carried forward. In the two previous Bundibugyo outbreaks the published case fatality ratios were 30 per cent in Uganda in 2007 and 50 per cent in the DR Congo in 2012.Cette épidémie est la plus étendue jamais enregistrée dans le pays : elle a plus que doublé celle de 2018 à 2020, que l’Organisation mondiale de la santé chiffre à 3 317 cas confirmés, et elle s’étend plus vite qu’aucune épidémie d’Ebola avant elle. Elle a été déclarée le 15 mai 2026 par le ministère de la Santé publique, de l’Hygiène et de la Prévoyance sociale, et qualifiée d’urgence de santé publique de portée internationale le 17 mai. Trois précautions accompagnent les chiffres. L’Organisation attribue une partie de la hausse au renforcement de la surveillance et de la capacité de laboratoire, mais dit que l’essentiel tient à l’extension de l’épidémie elle-même. Il n’existe toujours ni vaccin homologué ni traitement spécifique contre le virus Bundibugyo : les 2 007 personnes vaccinées au 6 septembre l’ont été avec un produit qui n’est pas homologué contre ce virus, et l’essai thérapeutique PARTNERS avait recruté plus de trois cents cas confirmés. Enfin, les bulletins du 28 août et du 10 septembre ne publient plus le nombre de soignants infectés, que le bulletin du 14 août chiffrait à au moins 155, dont 45 décès, au 9 août ; ces lignes ont été retirées plutôt que reportées. Lors des deux épidémies Bundibugyo précédentes, les létalités publiées étaient de 30 pour cent en Ouganda en 2007 et de 50 pour cent en RD Congo en 2012.
Source:Source : OMS, bulletin d’épidémie 2026-DON617, « Maladie à virus Bundibugyo — République démocratique du Congo », 10 septembre 2026 ; chiffres arrêtés au 7 septembre 2026, sauf la vaccination, arrêtée au 6 septembre.
Table compiled by James Wabenga Yango.Tableau composé par James Wabenga Yango.How to citeComment citer
The seventeenth outbreak by provinceLa dix-septième épidémie par province
Figure by James Wabenga Yango. Source: OMS, bulletin d’épidémie 2026-DON617, « Maladie à virus Bundibugyo — République démocratique du Congo », 10 septembre 2026 ; chiffres arrêtés au 7 septembre 2026, sauf la vaccination, arrêtée au 6 septembre.Figure de James Wabenga Yango. Source : OMS, bulletin d’épidémie 2026-DON617, « Maladie à virus Bundibugyo — République démocratique du Congo », 10 septembre 2026 ; chiffres arrêtés au 7 septembre 2026, sauf la vaccination, arrêtée au 6 septembre.How to citeComment citer
Health zones in the provinceZones de santé de la province
Confirmed casesCas confirmés
Confirmed cases, last 21 daysCas confirmés, 21 derniers jours
Ituri
2828
3636
5,4065 406
1,1141 114
North KivuNord-Kivu
1616
3434
1,0661 066
453453
Tshopo
77
2323
—
—
Haut-Uélé
66
1313
—
—
Bas-Uélé
33
1111
—
—
South KivuSud-Kivu
11
3434
—
00
The six provincesLes six provinces
6161
—
6,7576 757
—
Ituri carries 80 per cent of the confirmed cases, but the centre of gravity is shifting: North Kivu, with 1 066 cases, has the highest case fatality ratio of the six provinces, 65.4 per cent, and recorded 453 of its cases in the last twenty-one days alone. The bulletin publishes case counts province by province for Ituri and North Kivu only; for the other four the dash means that the figure is not in the source, not that it is zero. South Kivu has reported no case since 29 May 2026, hence the published zero. Kayna, in North Kivu, is the newest health zone to report a case. The second column counts the health zones where a case has been confirmed, the third the health zones the province contains, so the two together say how far the outbreak has room to run. Of the sixty-one zones touched, fifty-one had a case in the last twenty-one days.L’Ituri porte 80 pour cent des cas confirmés, mais le centre de gravité se déplace : le Nord-Kivu, avec 1 066 cas, a la létalité la plus élevée des six provinces, 65,4 pour cent, et a enregistré 453 de ses cas dans les seuls vingt et un derniers jours. Le bulletin ne publie le décompte des cas province par province que pour l’Ituri et le Nord-Kivu ; pour les quatre autres, le tiret signifie que le chiffre n’est pas dans la source, non qu’il est nul. Le Sud-Kivu n’a signalé aucun cas depuis le 29 mai 2026, d’où le zéro publié. Kayna, au Nord-Kivu, est la dernière zone de santé à avoir signalé un cas. La deuxième colonne compte les zones de santé où un cas a été confirmé, la troisième celles que la province compte : les deux ensemble disent ce qu’il reste d’espace à l’épidémie. Des soixante et une zones touchées, cinquante et une ont eu un cas dans les vingt et un derniers jours.
Source:Source : OMS, bulletin d’épidémie 2026-DON617, « Maladie à virus Bundibugyo — République démocratique du Congo », 10 septembre 2026 ; chiffres arrêtés au 7 septembre 2026, sauf la vaccination, arrêtée au 6 septembre.
Table compiled by James Wabenga Yango.Tableau composé par James Wabenga Yango.How to citeComment citer
Ituri, the health zones the bulletin namesIturi, les zones de santé que le bulletin nomme
Figure by James Wabenga Yango. Source: OMS, bulletin d’épidémie 2026-DON614, « Maladie à virus Bundibugyo — République démocratique du Congo », 1er août 2026, révisé le 3 août 2026 ; source des données, Centre des opérations d’urgences de santé publique (COUSP-RDC), chiffres arrêtés au 30 juillet 2026.Figure de James Wabenga Yango. Source : OMS, bulletin d’épidémie 2026-DON614, « Maladie à virus Bundibugyo — République démocratique du Congo », 1er août 2026, révisé le 3 août 2026 ; source des données, Centre des opérations d’urgences de santé publique (COUSP-RDC), chiffres arrêtés au 30 juillet 2026.How to citeComment citer
This table stops on 30 July 2026, the cut-off of the bulletin named below it: no later bulletin has named a health zone, and the table is left at its own date rather than mixed with a more recent one. These are the six health zones of Ituri with the highest counts, and the only six the bulletin names. Ituri had 3 176 confirmed cases at that date, spread over twenty-eight of its thirty-six health zones, so the remainder is distributed across the twenty-two others, which the source does not enumerate. Mongbwalu is where the outbreak began: it was confined to that single health zone before spreading to five provinces in two months, and to a sixth in three.Ce tableau s’arrête au 30 juillet 2026, date d’arrêt du bulletin nommé au-dessous : aucun bulletin postérieur n’a nommé de zone de santé, et le tableau est laissé à sa propre date plutôt que mêlé à une plus récente. Ce sont les six zones de santé de l’Ituri aux décomptes les plus élevés, et les six seules que le bulletin nomme. L’Ituri comptait à cette date 3 176 cas confirmés répartis sur vingt-huit de ses trente-six zones de santé : le reste se distribue donc sur les vingt-deux autres, que la source n’énumère pas. Mongbwalu est le point de départ de l’épidémie : celle-ci y était confinée avant de gagner cinq provinces en deux mois, et une sixième en trois.
Source:Source : OMS, bulletin d’épidémie 2026-DON614, « Maladie à virus Bundibugyo — République démocratique du Congo », 1er août 2026, révisé le 3 août 2026 ; source des données, Centre des opérations d’urgences de santé publique (COUSP-RDC), chiffres arrêtés au 30 juillet 2026.
Table compiled by James Wabenga Yango.Tableau composé par James Wabenga Yango.How to citeComment citer
The seventeen Ebola outbreaks, 1976 to 2026Les dix-sept épidémies d’Ebola, de 1976 à 2026
Figure by James Wabenga Yango. Source: Centers for Disease Control and Prevention, « History of Ebola Outbreaks », page revue le 29 mai 2026, pour les seize premières épidémies ; OMS, bulletin d’épidémie 2026-DON617 du 10 septembre 2026, pour la dix-septième.Figure de James Wabenga Yango. Source : Centers for Disease Control and Prevention, « History of Ebola Outbreaks », page revue le 29 mai 2026, pour les seize premières épidémies ; OMS, bulletin d’épidémie 2026-DON617 du 10 septembre 2026, pour la dix-septième.How to citeComment citer
Kasaï-Occidental, Luebo and MwekaKasaï-Occidental, Luebo et Mweka
Zaire
264264
187187
71.071,0
5th5e
2008-2009
Kasaï-Occidental, Mweka and LueboKasaï-Occidental, Mweka et Luebo
Zaire
3232
1515
47.047,0
6th6e
2012
Orientale, IsiroOrientale, Isiro
Bundibugyo
6262
3434
55.055,0
7th7e
2014
Équateur, BoendeÉquateur, Boende
Zaire
6969
4949
71.071,0
8th8e
2017
Likati
Zaire
88
44
50.050,0
9th9e
2018
Équateur, BikoroÉquateur, Bikoro
Zaire
5454
3333
61.061,0
10th10e
2018-2020
North Kivu, Ituri and South KivuNord-Kivu, Ituri et Sud-Kivu
Zaire
3,4703 470
2,2872 287
66.066,0
11th11e
2020
Équateur, MbandakaÉquateur, Mbandaka
Zaire
130130
5555
42.342,3
12th12e
2021
North Kivu, BienaNord-Kivu, Biena
Zaire
1212
66
50.050,0
13th13e
2021
North Kivu, BeniNord-Kivu, Beni
Zaire
1111
99
82.082,0
14th14e
2022
Équateur, MbandakaÉquateur, Mbandaka
Zaire
55
55
100.0100,0
15th15e
2022
North Kivu, BeniNord-Kivu, Beni
Zaire
11
11
100.0100,0
16th16e
2025
Kasaï, BulapeKasaï, Bulape
Zaire
6464
4545
70.070,0
17th17e
2026
Ituri, North Kivu, South Kivu, Haut-Uélé, Tshopo, Bas-UéléIturi, Nord-Kivu, Sud-Kivu, Haut-Uélé, Tshopo, Bas-Uélé
Bundibugyo
6,7576 757
3,2673 267
48.348,3
Fifty years in one table. The case counts and the fatality ratios are those the source publishes; none is recomputed here, which is why the ratios do not always follow exactly from the two columns to their left. Two rows need a word. The tenth outbreak is given at 3 470 cases because the American count includes probable and suspected cases; the World Health Organization counts 3 317 confirmed for the same episode, and it is against that confirmed figure that the outbreak now under way, at 6 757 confirmed, is described as the largest the country has known. The sixteenth is likewise given at 64 cases including probable ones. Fifteen of the seventeen outbreaks were caused by the Zaire virus; only the sixth and the seventeenth were caused by the Bundibugyo virus, for which no vaccine exists. The last column is worth reading on its own: an outbreak caught in one health zone kills a handful of people, one that reaches a city kills thousands.Cinquante ans en un tableau. Les décomptes de cas et les létalités sont ceux que publie la source ; aucun n’est recalculé ici, ce qui explique que les taux ne se déduisent pas toujours exactement des deux colonnes qui les précèdent. Deux lignes appellent un mot. La dixième épidémie est portée à 3 470 cas parce que le décompte américain inclut les cas probables et suspects ; l’Organisation mondiale de la santé retient 3 317 cas confirmés pour le même épisode, et c’est à ce chiffre de cas confirmés que l’épidémie en cours, à 6 757 cas confirmés, est comparée lorsqu’on la dit la plus étendue que le pays ait connue. La seizième est de même portée à 64 cas, cas probables inclus. Quinze des dix-sept épidémies sont dues au virus Zaïre ; seules la sixième et la dix-septième sont dues au virus Bundibugyo, contre lequel il n’existe pas de vaccin. La dernière colonne se lit pour elle-même : une épidémie arrêtée dans une seule zone de santé tue quelques personnes, une épidémie qui atteint une ville en tue des milliers.
Source:Source : Centers for Disease Control and Prevention, « History of Ebola Outbreaks », page revue le 29 mai 2026, pour les seize premières épidémies ; OMS, bulletin d’épidémie 2026-DON617 du 10 septembre 2026, pour la dix-septième.
Table compiled by James Wabenga Yango.Tableau composé par James Wabenga Yango.How to citeComment citer
Other diseases under surveillanceAutres maladies sous surveillance
Disease and scopeMaladie et périmètre
PeriodPériode
CasesCas
DeathsDécès
Mpox, confirmed, DR CongoMpox, confirmés, RD Congo
July 2026Juillet 2026
8585
0.000,00
Mpox, confirmed, DR CongoMpox, confirmés, RD Congo
6 July to 16 August 20266 juillet au 16 août 2026
4141
0.000,00
Mpox, confirmed, Africa, 35 countriesMpox, confirmés, Afrique, 35 pays
1 January 2025 to 16 August 20261er janvier 2025 au 16 août 2026
52,42452 424
238.00238,00
Mpox, confirmed, worldMpox, confirmés, monde
1 January 2025 to 31 July 20261er janvier 2025 au 31 juillet 2026
65,78465 784
264.00264,00
Cholera, suspected and confirmed, DR CongoCholéra, suspects et confirmés, RD Congo
1 January to 31 May 20261er janvier au 31 mai 2026
28,56728 567
815.00815,00
Cholera, suspected and confirmed, DR CongoCholéra, suspects et confirmés, RD Congo
May 2026Mai 2026
3,6513 651
82.0082,00
Circulating vaccine-derived poliovirus type 1, DR CongoPoliovirus circulant dérivé d’une souche vaccinale de type 1, RD Congo
2025
11
—
Circulating vaccine-derived poliovirus type 2, DR CongoPoliovirus circulant dérivé d’une souche vaccinale de type 2, RD Congo
2025
—
—
Measles, DR CongoRougeole, RD Congo
—
—
—
Four diseases, four states of knowledge, and the table is built so that the difference shows. The mpox counts are confirmed cases, and the zeros in the death column are published zeros, not blanks; the World Health Organization attaches a warning to every Congolese mpox figure it prints, namely that reporting is delayed because national capacity is absorbed by the Bundibugyo response, so these are floors. The cholera counts mix suspected, rapid-test-positive and culture-confirmed cases, as the source does, and cannot be read as confirmed cases. For poliovirus the emergency committee names the DR Congo among the countries where both type 1 and type 2 circulate and gives one type 1 case for 2025, but publishes numeric type 2 counts only for Nigeria, Ethiopia and Yemen: the dash is the absence of a published figure, not the absence of the disease. Measles carries dashes throughout, and the reason is worth stating plainly. The organisation's measles surveillance figures are served from an interactive dashboard rather than published as a citable document, and this page prints nothing it cannot cite. The cells will be filled on the day a dated, attributable figure exists.Quatre maladies, quatre états du savoir, et le tableau est bâti pour que la différence se voie. Les décomptes de mpox sont des cas confirmés, et les zéros de la colonne des décès sont des zéros publiés, non des cases vides ; l’Organisation mondiale de la santé assortit chaque chiffre congolais de mpox qu’elle imprime d’un avertissement, à savoir que la remontée d’information est retardée parce que la capacité nationale est absorbée par la riposte Bundibugyo : ce sont donc des planchers. Les décomptes de choléra mêlent cas suspects, cas positifs au test rapide et cas confirmés par culture, comme le fait la source, et ne se lisent pas comme des cas confirmés. Pour le poliovirus, le comité d’urgence nomme la RD Congo parmi les pays où circulent les types 1 et 2 et donne un cas de type 1 pour 2025, mais ne publie de décompte chiffré de type 2 que pour le Nigeria, l’Éthiopie et le Yémen : le tiret est l’absence d’un chiffre publié, non l’absence de la maladie. La rougeole porte des tirets partout, et la raison mérite d’être dite sans détour. Les chiffres de surveillance de la rougeole de l’Organisation sont servis par un tableau de bord interactif plutôt que publiés sous forme de document citable, et cette page n’imprime rien qu’elle ne puisse citer. Les cases seront remplies le jour où un chiffre daté et attribuable existera.
Source:Source : OMS, « Multi-country outbreak of mpox, external situation report nº 69 », 14 septembre 2026 ; « Multi-country outbreak of cholera, epidemiological update nº 38 », 30 juin 2026 ; déclaration de la quarante-quatrième réunion du comité d’urgence du Règlement sanitaire international sur la poliomyélite, 4 mars 2026.
Table compiled by James Wabenga Yango.Tableau composé par James Wabenga Yango.How to citeComment citer
The real cycle, period by periodLe cycle réel, période par période
The figure above this section plots real growth and inflation from 1990 to the present against the political periods; the first table below states the same thing in numbers. Four periods, four regimes of the real economy: contraction with moderate inflation at the end of the Mobutu years, contraction with hyperinflation through the war, a long reconstruction that grew at close to six per cent, and the present administration, which grows about as fast with half the volatility and the lowest median inflation of the four. The second table sets out what the authorities have said they will do, as published, with the figure or the date attached to each measure. It is a record of commitments, not a list of recommendations, and the distinction is kept deliberately.
La figure placée au-dessus de cette section porte la croissance réelle et l’inflation de 1990 à aujourd’hui sur les périodes politiques ; le premier tableau ci-dessous dit la même chose en chiffres. Quatre périodes, quatre régimes de l’économie réelle : contraction et inflation modérée à la fin de la période Mobutu, contraction et hyperinflation pendant la guerre, une longue reconstruction proche de six pour cent, et l’administration actuelle, qui croît à peu près aussi vite avec la moitié de la volatilité et la plus faible inflation médiane des quatre. Le second tableau expose ce que les autorités ont annoncé, tel que publié, avec le chiffre ou la date attachés à chaque mesure. C’est un relevé d’engagements, non une liste de recommandations, et la distinction est tenue à dessein.
The real cycle by political periodLe cycle réel par période politique
Figure by James Wabenga Yango. Source: IMF, World Bank, BCC, AfDB.Figure de James Wabenga Yango. Source : FMI, Banque mondiale, BCC, BAD.How to citeComment citer
Figure by James Wabenga Yango. Source: Calculs de l’auteur sur les séries de croissance du PIB réel et d’inflation publiées sur cette page (FMI, Banque mondiale, BCC, BAD).Figure de James Wabenga Yango. Source : Calculs de l’auteur sur les séries de croissance du PIB réel et d’inflation publiées sur cette page (FMI, Banque mondiale, BCC, BAD).How to citeComment citer
These are the author’s calculations on the two long series published on this page, real GDP growth and consumer price inflation, cut at the political breaks used by the figure « The real cycle, by political period » in the stylised facts tab. Three readings. The first two periods are one long contraction: the economy loses about six per cent a year for eleven years, and ten of those eleven years are years of decline. The turn comes in 2002, not with a change of head of state but with the end of the war and the resumption of external financing. Growth since has been of the same order under two administrations, 5.8 and 5.4 per cent, and the real difference between them is not the mean but the floor: one contraction in eighteen years, none in eight. The median is used for inflation rather than the mean, because a mean taken across a year at 23 863 per cent describes nothing. 2025 and 2026 are projections.Ce sont des calculs de l’auteur sur les deux longues séries publiées sur cette page, la croissance du PIB réel et l’inflation des prix à la consommation, découpées aux ruptures politiques retenues par la figure « Le cycle réel, par période politique » de l’onglet des faits stylisés. Trois lectures. Les deux premières périodes n’en font qu’une, celle d’une longue contraction : l’économie perd environ six pour cent par an pendant onze ans, et dix de ces onze années sont des années de recul. Le retournement vient en 2002, non avec un changement de chef de l’État mais avec la fin de la guerre et la reprise des financements extérieurs. La croissance est depuis du même ordre sous deux administrations, 5,8 et 5,4 pour cent, et la différence réelle entre elles n’est pas la moyenne mais le plancher : un recul en dix-huit ans, aucun en huit. La médiane sert pour l’inflation plutôt que la moyenne, parce qu’une moyenne prise sur une année à 23 863 pour cent ne décrit rien. 2025 et 2026 sont des projections.
Source:Source : Calculs de l’auteur sur les séries de croissance du PIB réel et d’inflation publiées sur cette page (FMI, Banque mondiale, BCC, BAD).
Table compiled by James Wabenga Yango.Tableau composé par James Wabenga Yango.How to citeComment citer
Measures set out for the authorities, with their deadlinesMesures énoncées à l’intention des autorités, avec leurs échéances
DomainDomaine
Measure as publishedMesure telle que publiée
Quantified target or dateCible chiffrée ou échéance
RevenueRecettes
The Fund calls for the revenue mobilisation plan to be accelerated: mining oversight, digitalisation, a standardised VAT invoice, a wider baseLe Fonds demande d’accélérer le plan de mobilisation des recettes : contrôle minier, numérisation, facture normalisée de TVA, élargissement de l’assiette
+0,7 % of GDP in 2026+0,7 % du PIB en 2026
RevenueRecettes
The Fund calls for the tax codes to be completed and provincial taxation harmonisedLe Fonds demande d’achever les codes fiscaux et d’harmoniser la fiscalité provinciale
End-2026Fin 2026
RevenueRecettes
The Fund calls for fuel pricing reform and the removal of industrial exemptions and subsidiesLe Fonds demande la réforme du prix des carburants et la suppression des exonérations et subventions industrielles
≈ 280 $m of tax expenditure in 2024≈ 280 M USD de dépense fiscale en 2024
Public financesFinances publiques
The Fund calls for a public sector reform strategy and a national wage policy, urgentlyLe Fonds demande sans délai une stratégie de réforme du secteur public et une politique salariale nationale
Wage bill above 50 % of tax revenueMasse salariale au-dessus de 50 % des recettes fiscales
Public financesFinances publiques
The Fund calls for the treasury single account and for spending authorisation to be decentralised to pilot ministriesLe Fonds demande le compte unique du Trésor et la décentralisation de l’ordonnancement vers des ministères pilotes
February 2026Février 2026
Public financesFinances publiques
The Fund calls for recurrent security spending to leave the emergency procedure and return to standard procedureLe Fonds demande que les dépenses de sécurité récurrentes quittent la procédure d’urgence pour la procédure normale
17,4 % of spending under emergency procedure in 202517,4 % des dépenses en procédure d’urgence en 2025
Public financesFinances publiques
The Fund calls for domestic arrears to be certified and tracked more frequentlyLe Fonds demande une certification et un suivi plus fréquents des arriérés intérieurs
4,98 $bn certified, 5,4 % of GDP4,98 Md USD certifiés, 5,4 % du PIB
Money and reservesMonnaie et réserves
The Fund calls for a careful, data-dependent easing cycle, held if the currency depreciates sharplyLe Fonds demande un assouplissement prudent et guidé par les données, suspendu en cas de forte dépréciation
BCC target of 7 % inflationCible de 7 % d’inflation de la BCC
Money and reservesMonnaie et réserves
The Fund calls for faster conversion into dollars of the reserve requirements held in francs on foreign currency depositsLe Fonds demande une conversion plus rapide en dollars des réserves obligatoires détenues en francs sur les dépôts en devises
Above the current 5 % a yearAu-delà des 5 % par an actuels
GovernanceGouvernance
The Fund calls the law creating the economic and financial criminal court critical, and the anti-corruption bill to be tabledLe Fonds juge critique la loi créant la cour pénale économique et financière, et le dépôt du projet de loi anticorruption
June 2026Juin 2026
GovernanceGouvernance
The Fund calls exit from the financial action task force grey list critical to correspondent bankingLe Fonds juge la sortie de la liste grise du GAFI critique pour les relations de correspondance bancaire
No date givenSans date
Business climateClimat des affaires
The Fund calls for the strategic business climate plan, a VAT refund action plan, and a working tax mediation commissionLe Fonds demande le plan stratégique du climat des affaires, un plan d’action sur les remboursements de TVA et une commission de médiation fiscale opérationnelle
April, March and June 2026Avril, mars et juin 2026
PovertyPauvreté
The Bank sets out that resource revenue must be allocated more pro-poor, with more basic services, infrastructure and income opportunitiesLa Banque énonce que la rente doit être affectée plus favorablement aux pauvres, avec davantage de services de base, d’infrastructures et de sources de revenu
79,5 % poor at $3,00 a day by 202879,5 % de pauvres à 3,00 USD par jour en 2028
SecuritySécurité
The Bank sets out that governance must be strengthened, conflict resolved, security restored and illicit resource flows curbedLa Banque énonce qu’il faut renforcer la gouvernance, résoudre le conflit, rétablir la sécurité et endiguer les flux illicites de ressources
No date givenSans date
Nothing in this table is the author’s recommendation. Each line reports a measure that the Fund or the Bank has published, in the second review of the credit and sustainability arrangements of January 2026 and in the macro poverty outlook of April 2026, and the third column carries the target or the date the document itself attaches to it. The two institutions differ in a way worth seeing. The Fund writes a dated list of procedures; the Bank writes two sentences, both about who gets the money. They also differ on the facts: the Bank reads reserves at three months of imports and calls them stabilising, the Fund reads 11.7 weeks and calls them below adequate. Same country, same year, opposite verdict. Their deficit figures rest on different definitions and are not merged here.Rien dans ce tableau n’est une recommandation de l’auteur. Chaque ligne rapporte une mesure que le Fonds ou la Banque a publiée, dans la deuxième revue des accords de crédit et de durabilité de janvier 2026 et dans les perspectives macroéconomiques et de pauvreté d’avril 2026, et la troisième colonne porte la cible ou l’échéance que le document lui-même y attache. Les deux institutions diffèrent d’une manière qui mérite d’être vue. Le Fonds écrit une liste datée de procédures ; la Banque écrit deux phrases, toutes deux sur la question de savoir à qui va l’argent. Elles diffèrent aussi sur les faits : la Banque lit les réserves à trois mois d’importations et les juge stabilisantes, le Fonds lit 11,7 semaines et les juge en deçà du niveau adéquat. Même pays, même année, verdict inverse. Leurs chiffres de déficit reposent sur des définitions différentes et ne sont pas fondus ici.
Source:Source : FMI, République démocratique du Congo : deuxième revue des accords FEC et FRD, rapport pays nº 26/2, janvier 2026. Banque mondiale, Macro Poverty Outlook, édition d’avril 2026, fiche République démocratique du Congo ; seuils de pauvreté en parités de pouvoir d’achat de 2021.
Table compiled by James Wabenga Yango.Tableau composé par James Wabenga Yango.How to citeComment citer
Stylised facts of the Congolese economyFaits stylisés de l’économie congolaise
A structural model is only worth what it can reproduce. The plates and tables that follow set out what the Congolese data actually say, in the form a macroeconomist needs before writing down a model: the levels, the cyclical components once the trend has been filtered out, the lead and lag structure between each aggregate and output, and the traits that no business cycle can dissolve. They rest on the seventeen monthly series that feed my DSGE work, extended by the central bank and World Bank series this page refreshes each night, so they age with the data rather than with the writing.
Un modèle structurel ne vaut que ce qu’il reproduit. Les planches et les tableaux qui suivent établissent ce que disent les données congolaises, sous la forme dont un macroéconomiste a besoin avant d’écrire un modèle : les niveaux, les composantes cycliques une fois le trend filtré, la structure des avances et des retards entre chaque agrégat et la production, enfin les traits qu’aucun cycle ne dissout. Ils reposent sur les dix-sept séries mensuelles qui alimentent mes travaux d’équilibre général dynamique, prolongées par les séries de la banque centrale et de la Banque mondiale que cette page actualise chaque nuit : ils vieillissent donc avec les données, non avec la rédaction.
Business cycle moments, DR CongoMoments du cycle économique, RD Congo
Figure by James Wabenga Yango. Source: Banque centrale du Congo, Banque mondiale, FMI ; calculs de l’auteur.Figure de James Wabenga Yango. Source : Banque centrale du Congo, Banque mondiale, FMI ; calculs de l’auteur.How to citeComment citer
Cyclical components from a Hodrick-Prescott filter with lambda = 14400, on monthly data from 2013-01 to 2026-07. Level series are taken in logarithms, so the standard deviation reads as a percentage; rate series are filtered as they stand and the standard deviation reads in percentage points. The real aggregates (output, consumption, investment, hours) are published annually and interpolated to a monthly frequency, so their measured autocorrelation is an upper bound and should be read as one.Composantes cycliques obtenues par filtre Hodrick-Prescott, lambda = 14400, sur données mensuelles de 2013-01 à 2026-07. Les séries de niveau sont portées en logarithme, de sorte que l’écart-type se lit en pourcentage ; les séries de taux sont filtrées en l’état et l’écart-type se lit en points de pourcentage. Les agrégats réels (production, consommation, investissement, heures) sont publiés à fréquence annuelle puis mensualisés par interpolation ; leur autocorrélation mesurée constitue donc une borne supérieure et doit se lire comme telle.
Table compiled by James Wabenga Yango. Source: Banque centrale du Congo, Banque mondiale, FMI ; calculs de l’auteur.Tableau composé par James Wabenga Yango. Source : Banque centrale du Congo, Banque mondiale, FMI ; calculs de l’auteur.How to citeComment citer
The stylised facts under five filtersLes faits stylisés vus par cinq filtres
Hodrick-Prescott, λ = 14400Hodrick et Prescott, λ = 14400
0.890,89
0.730,73
3.013,01
0.980,98
0.890,89
0.980,98
Hamilton regression, h = 24, p = 12Régression de Hamilton, h = 24, p = 12
2.552,55
0.680,68
2.652,65
0.990,99
0.920,92
0.950,95
Baxter-King band pass, 18-96 monthsPasse-bande de Baxter et King, 18-96 mois
1.201,20
0.620,62
3.323,32
1.001,00
0.910,91
0.990,99
Christiano-Fitzgerald band pass, 18-96 monthsPasse-bande de Christiano et Fitzgerald, 18-96 mois
1.361,36
0.730,73
2.602,60
0.990,99
0.870,87
0.990,99
First differenceDifférence première
0.230,23
0.760,76
2.502,50
0.980,98
0.870,87
0.920,92
Monthly data from 2013-01 to 2026-07, level series in logarithms. Each row applies one filter to output, consumption and investment, then measures the same four moments. The smoothing parameter of the Hodrick-Prescott filter is 14400, the monthly counterpart of the 1600 used on quarterly data under the rule of Ravn and Uhlig, which scales lambda with the fourth power of the observation frequency. The Hamilton regression projects the series two years ahead on twelve monthly lags, the transposition of the h = 8, p = 4 that Hamilton recommends for quarterly data. The two band pass filters isolate cycles of eighteen to ninety-six months, the range Burns and Mitchell gave the business cycle; the Baxter-King filter truncates its weights at thirty-six months and therefore loses three years at each end of the sample, while the Christiano-Fitzgerald filter keeps every month at the cost of weights that vary with the position in the sample. Correlations and relative volatilities are computed on the months where both series are defined. What survives the choice of filter is the shape of the cycle rather than its size: the standard deviation of output ranges from a quarter of a point to two and a half points depending on the filter, while investment stays between two and a half and three and a half times as volatile as output, consumption stays smoother than output, and both stay strongly procyclical. The autocorrelation column is high under every filter, but the real aggregates are published annually and interpolated to a monthly frequency: that column measures the interpolation as much as the economy and should not be used as evidence of persistence.Données mensuelles de 2013-01 à 2026-07, séries de niveau en logarithme. Chaque ligne applique un filtre à la production, à la consommation et à l’investissement, puis mesure les mêmes quatre moments. Le paramètre de lissage du filtre de Hodrick et Prescott vaut 14400, la contrepartie mensuelle du 1600 retenu sur données trimestrielles selon la règle de Ravn et Uhlig, qui fait varier lambda comme la puissance quatre de la fréquence d’observation. La régression de Hamilton projette la série à deux ans sur douze retards mensuels, transposition du couple h = 8, p = 4 que Hamilton recommande au trimestre. Les deux filtres passe-bande isolent les cycles de dix-huit à quatre-vingt-seize mois, l’intervalle que Burns et Mitchell assignaient au cycle des affaires ; celui de Baxter et King tronque ses poids à trente-six mois et perd donc trois ans à chaque extrémité de l’échantillon, tandis que celui de Christiano et Fitzgerald conserve tous les mois, au prix de poids qui varient avec la position dans l’échantillon. Les corrélations et les volatilités relatives sont calculées sur les mois où les deux séries sont définies. Ce qui résiste au choix du filtre est la forme du cycle, non son amplitude : l’écart-type de la production va d’un quart de point à deux points et demi selon le filtre, tandis que l’investissement reste deux fois et demie à trois fois et demie plus volatil que la production, que la consommation reste plus lisse qu’elle et que l’un et l’autre restent nettement procycliques. La colonne d’autocorrélation est élevée sous tous les filtres, mais les agrégats réels sont publiés à fréquence annuelle puis mensualisés par interpolation : cette colonne mesure l’interpolation autant que l’économie et ne saurait servir de preuve de persistance.
Table compiled by James Wabenga Yango. Source: Banque centrale du Congo, Banque mondiale, FMI ; calculs de l’auteur.Tableau composé par James Wabenga Yango. Source : Banque centrale du Congo, Banque mondiale, FMI ; calculs de l’auteur.How to citeComment citer
Structural features of the Congolese economyTraits de structure de l’économie congolaise
Figure by James Wabenga Yango. Source: IMF Article IV, EITI-DRC, USGS, Global Findex.Figure de James Wabenga Yango. Source : FMI article IV, ITIE-RDC, USGS, Global Findex.How to citeComment citer
Mining, share of goods exportsMines, part des exportations de biens
98.998,9
IMF Article IVFMI, article IV
Mining, share of fiscal revenueMines, part des recettes fiscales
46.046,0
EITI-DRCITIE-RDC
Cobalt, share of world outputCobalt, part de la production mondiale
76.076,0
USGSUSGS
Bank deposits held in foreign currencyDépôts bancaires en devises
90.990,9
IMF Article IVFMI, article IV
Adults with an account at a financial institutionAdultes disposant d’un compte bancaire
26.026,0
Global FindexGlobal Findex
Each line refers to the official publication cited beside it. The first four describe one and the same dependence, seen from external trade, from the budget, from the world market and from the banking system; the fifth measures what limits the transmission of monetary policy.Chaque ligne renvoie à la publication officielle citée en regard. Les quatre premières décrivent une seule et même dépendance, vue du commerce extérieur, du budget, du marché mondial et du système bancaire ; la cinquième mesure ce qui limite la transmission de la politique monétaire.
Table compiled by James Wabenga Yango. Source: FMI, ITIE-RDC, USGS, Global Findex.Tableau composé par James Wabenga Yango. Source : FMI, ITIE-RDC, USGS, Global Findex.How to citeComment citer
Which filter, and why these parametersQuel filtre, et pourquoi ces paramètres
A cycle is not observed; it is what remains once a trend has been removed, and the trend is a choice. Reporting a single detrending would hide that choice, so the series are passed through five estimators and the results are shown side by side. What is asked of them is not that they agree on the size of the gap (they do not, the standard deviation of the output cycle runs from 0.2 to 2.6 per cent depending on the filter) but that they agree on the dates of the turns and on the ordering of the volatilities. They do.
Un cycle ne s’observe pas : il est ce qui reste une fois la tendance retirée, et la tendance est un choix. Ne publier qu’un seul détrendage reviendrait à masquer ce choix ; les séries sont donc passées par cinq estimateurs et les résultats sont montrés côte à côte. Ce qu’on leur demande n’est pas de s’accorder sur l’ampleur de l’écart (ils ne s’accordent pas, l’écart-type du cycle de la production va de 0,2 à 2,6 pour cent selon le filtre) mais de s’accorder sur la date des retournements et sur le classement des volatilités. Ils s’accordent.
The smoothing parameter of the Hodrick–Prescott filter is set at λ = 14400. It is not a free number. Hodrick and Prescott (1997) calibrated λ = 1600 on quarterly United States data, as the price at which a trend is allowed to bend. Backus and Kehoe (1992) carried that calibration to other frequencies by the square of the frequency ratio, which gives 1600 × 3² = 14400 for monthly data; Ravn and Uhlig (2002) redid the exercise and obtained the fourth power, 1600 × 3⁴ = 129600. The plate on the smoothing parameter shows all three, 1600, 14400 and 129600, on the same series, so that the reader can see what the choice buys and what it costs: a low value hands the movement to the trend and leaves a flat cycle, a high one holds the trend straight and pushes every swing into the cycle. The tables use 14400, the intermediate and the more common convention for monthly work, and the plate is there so that the convention is visible rather than implicit.
Le paramètre de lissage du filtre de Hodrick et Prescott est fixé à λ = 14400. Ce n’est pas un nombre libre. Hodrick et Prescott (1997) ont calibré λ = 1600 sur des données trimestrielles américaines, comme le prix auquel on autorise la tendance à se courber. Backus et Kehoe (1992) ont transporté ce calibrage aux autres fréquences par le carré du rapport de fréquence, ce qui donne 1600 × 3² = 14400 en mensuel ; Ravn et Uhlig (2002) ont refait l’exercice et obtenu la puissance quatrième, 1600 × 3⁴ = 129600. La planche consacrée au lissage montre les trois valeurs, 1600, 14400 et 129600, sur la même série, pour que le lecteur voie ce que le choix achète et ce qu’il coûte : une valeur faible confie le mouvement à la tendance et laisse un cycle plat, une valeur forte maintient la tendance droite et rejette toute l’oscillation dans le cycle. Les tableaux retiennent 14400, la valeur intermédiaire et la convention la plus répandue en mensuel, et la planche est là pour que cette convention soit visible au lieu d’être tacite.
The four other estimators answer four known objections to that filter. Hamilton (2018) objects that the Hodrick–Prescott cycle is a filtered artefact with no economic content, and proposes instead the residual of a regression of the series on its own value h periods earlier and p − 1 further lags; the two-year horizon he recommends, h = 8 quarters and p = 4, becomes h = 24 and p = 12 months here. Baxter and King (1999) and Christiano and Fitzgerald (2003) object that a trend should be defined by frequency and not by curvature, and keep only the movements whose period lies between eighteen and ninety-six months, that is between a year and a half and eight years, the band Burns and Mitchell fixed for the business cycle in 1946. The Baxter–King approximation is truncated at K = 36 months, which is the three-year window they recommend and which costs three years of data at each end of the sample; the Christiano–Fitzgerald filter is used in its asymmetric full-sample form, which loses no observation at the price of a weight that changes with the date. The first difference, finally, has no parameter at all: it is there as the benchmark against which the other four have to justify their machinery.
Les quatre autres estimateurs répondent à quatre objections connues faites à ce filtre. Hamilton (2018) objecte que le cycle de Hodrick et Prescott est un artefact de filtrage sans contenu économique, et propose à sa place le résidu d’une régression de la série sur sa propre valeur h périodes plus tôt et p − 1 retards supplémentaires ; l’horizon de deux ans qu’il recommande, h = 8 trimestres et p = 4, devient ici h = 24 et p = 12 mois. Baxter et King (1999) et Christiano et Fitzgerald (2003) objectent qu’une tendance devrait se définir par la fréquence et non par la courbure, et ne retiennent que les mouvements dont la période est comprise entre dix-huit et quatre-vingt-seize mois, soit entre un an et demi et huit ans, la bande que Burns et Mitchell ont fixée au cycle des affaires en 1946. L’approximation de Baxter et King est tronquée à K = 36 mois, la fenêtre de trois ans qu’ils recommandent, et qui coûte trois années de données à chaque extrémité de l’échantillon ; le filtre de Christiano et Fitzgerald est employé dans sa forme asymétrique en échantillon complet, qui ne perd aucune observation au prix d’une pondération qui change avec la date. La différence première, enfin, n’a aucun paramètre : elle est là comme étalon, celui devant lequel les quatre autres doivent justifier leur appareillage.
One warning belongs with these plates. Several of the monthly series are interpolated from annual publications, which the filters cannot know: the autocorrelation column of the comparison table therefore measures the interpolation as much as it measures the persistence of the Congolese economy, and should be read as an upper bound. What does survive every filter is the shape rather than the size: investment stays two and a half to three and a half times as volatile as output, consumption stays smoother than output, and both stay procyclical.
Un avertissement accompagne ces planches. Plusieurs des séries mensuelles sont interpolées à partir de publications annuelles, ce que les filtres ne peuvent pas savoir : la colonne d’autocorrélation du tableau de comparaison mesure donc l’interpolation autant que la persistance de l’économie congolaise, et doit se lire comme une borne supérieure. Ce qui survit à tous les filtres, c’est la forme plutôt que l’ampleur : l’investissement reste deux fois et demie à trois fois et demie plus volatil que la production, la consommation reste plus lisse que la production, et les deux restent procycliques.
Statistical platesPlanches statistiques
The plates below are redrawn during the nightly refresh, from the very same series that the download buttons export. They are vector images: they stay sharp at any size and they print cleanly. Every table on this page can also be exported as a LaTeX booktabs document with the TEX button.
Les planches ci-dessous sont retracées lors de l’actualisation nocturne, à partir des séries mêmes qu’exportent les boutons de téléchargement. Ce sont des images vectorielles : elles restent nettes à toute taille et s’impriment proprement. Chaque tableau de cette page s’exporte également en document LaTeX booktabs par le bouton TEX.
Figure by James Wabenga Yango. Source: Central Bank of the Congo, World Bank, IMF; author’s calculations.Figure de James Wabenga Yango. Source : Banque centrale du Congo, Banque mondiale, FMI ; calculs de l’auteur.How to citeComment citer
Macroeconomic reading. Over 152 months (January 2013 to August 2025) the price index rises from 122.8 to 490, a factor of 4, and the exchange rate from 913 to 2,866 francs per dollar (a factor of 3.1). The currency depreciates more slowly than prices rise, so the real exchange rate appreciates, which weighs on non-mining tradables. Broad money M2 grows eighteenfold (2.6 to 47.2 million francs), far beyond prices; the gap reflects financial deepening and dollarised deposits rather than purchasing power created from nothing. Reserves fall to 0.41 in October 2019 and reach 22.0 in July 2025, a fifty-fold rise driven by mining receipts, not by a diversified surplus. The real series (output, consumption, investment) are 2013 = 100 indices interpolated from annual data; they show trends, not monthly movements.
Lecture macroéconomique. Sur 152 mois (janvier 2013 à août 2025), l'indice des prix passe de 122,8 à 490, soit un facteur 4, et le taux de change de 913 à 2 866 francs par dollar (facteur 3,1) : la dépréciation est plus lente que la hausse des prix, donc le taux de change réel s'apprécie sur la période, ce qui pèse sur les secteurs exposés hors mines. La masse monétaire M2 est multipliée par 18 (2,6 à 47,2 millions de francs), bien au-delà des prix : la différence reflète l'approfondissement financier et la dollarisation des dépôts, pas une simple création de pouvoir d'achat. Les réserves de change tombent à 0,41 en octobre 2019 puis atteignent 22,0 en juillet 2025, soit un bond d'un facteur 50 : l'abondance de devises vient des recettes minières, non d'un excédent diversifié. Les séries réelles (production, consommation, investissement) sont des indices base 100 en 2013 interpolés à partir de données annuelles ; elles indiquent des tendances, non des mouvements mensuels.
Figure by James Wabenga Yango. Source: Central Bank of the Congo, World Bank, IMF; author’s calculations.Figure de James Wabenga Yango. Source : Banque centrale du Congo, Banque mondiale, FMI ; calculs de l’auteur.How to citeComment citer
Macroeconomic reading. Deviations from the Hodrick-Prescott trend (smoothing 14,400) are small for real aggregates (standard deviation 0.89 percent for output) and large for financial and commodity variables (5.4 percent for M2, 9.8 for copper, 24.7 for reserves). This is typical of an economy where real activity follows a smooth trend while asset prices, the exchange rate and world prices absorb the shocks. Because the real aggregates are interpolated from annual data, their low volatility is partly mechanical and should not be read as greater stability than comparable countries.
Lecture macroéconomique. Les écarts à la tendance de Hodrick-Prescott (lissage 14 400) sont de petite taille pour les agrégats réels (écart-type de 0,89 % pour la production) et très grands pour les variables financières et de matières premières (5,4 % pour M2, 9,8 % pour le cuivre, 24,7 % pour les réserves). Ce contraste est typique d'une économie dont l'activité réelle suit une tendance lissée alors que les prix d'actifs, les devises et les prix mondiaux absorbent les chocs. Comme les agrégats réels sont interpolés depuis des données annuelles, leur faible volatilité est en partie mécanique : on ne doit pas conclure que l'activité est plus stable que les pays comparables.
Figure by James Wabenga Yango. Source: Author’s calculations on the monthly series.Figure de James Wabenga Yango. Source : Calculs de l’auteur sur les séries mensuelles.How to citeComment citer
Macroeconomic reading. Contemporaneous correlation with output is high for consumption (0.98), investment (0.89), exports (0.89) and imports (0.87), weak for hours (0.41), and close to zero for prices (0.22), M2 (0.07), reserves (0.07), copper (−0.08) and the exchange rate (−0.14). The real series co-move because all derive from the same annual accounts; the weak correlation of financial variables means their swings do not predict the measured cycle. A peak to the right of zero (series lags output) is not causality: with interpolated real data only sign and order of magnitude are informative.
Lecture macroéconomique. La corrélation contemporaine avec la production est forte pour la consommation (0,98), l'investissement (0,89), les exportations (0,89) et les importations (0,87), faible pour les heures (0,41) et quasi nulle pour les prix (0,22), M2 (0,07), les réserves (0,07), le cuivre (−0,08) et le taux de change (−0,14). Les séries réelles bougent ensemble parce qu'elles sont toutes dérivées des mêmes comptes annuels ; la faible corrélation des variables financières signifie que leurs fluctuations ne prédisent pas le cycle mesuré. Le décalage du pic (à droite de zéro = série en retard) ne doit pas être lu comme causalité : avec des données réelles interpolées, seul le signe et l'ordre de grandeur sont informatifs.
Figure by James Wabenga Yango. Source: Central Bank of the Congo, World Bank; author’s calculations.Figure de James Wabenga Yango. Source : Banque centrale du Congo, Banque mondiale ; calculs de l’auteur.How to citeComment citer
Macroeconomic reading. The four exposures are structural: mining supplies 98.9 percent of goods exports and 46 percent of tax revenue, the DR Congo produces 76 percent of world cobalt, 90.9 percent of deposits are in foreign currency, and only 26 percent of adults hold a bank account. A copper or cobalt price shock therefore passes straight into revenue, reserves and the exchange rate, while the central bank has little leverage over credit because the national currency is only part of liquidity (see the money multiplier). Shaded bands mark stress episodes; they are not forecasts.
Lecture macroéconomique. Les quatre vulnérabilités sont structurelles : les mines représentent 98,9 % des exportations de biens et 46 % des recettes fiscales, la RDC fournit 76 % du cobalt mondial, 90,9 % des dépôts sont en devises et seuls 26 % des adultes ont un compte bancaire. La conséquence est double : un choc de prix du cuivre ou du cobalt se transmet immédiatement aux recettes, aux réserves et au taux de change, et la banque centrale a peu de prise sur le crédit parce que la monnaie nationale n'est qu'une fraction de la liquidité (voir le multiplicateur monétaire). Les bandes grisées marquent les épisodes de tension ; elles ne sont pas des prévisions.
Figure by James Wabenga Yango. Source: Central Bank of the Congo, World Bank, IMF; author’s calculations.Figure de James Wabenga Yango. Source : Banque centrale du Congo, Banque mondiale, FMI ; calculs de l’auteur.How to citeComment citer
Macroeconomic reading. Five filters (HP, Baxter-King, Christiano-Fitzgerald, Hamilton, first difference) applied to output give cycles that agree on the timing of turns but not on amplitude, hence the free vertical scale. Band-pass filters lose observations at the ends and the HP filter is unstable at the sample end, so the latest points of the cycle are the least reliable.
Lecture macroéconomique. Cinq filtres (HP, Baxter-King, Christiano-Fitzgerald, Hamilton, différence) appliqués à la production donnent des cycles qui s'accordent sur le calendrier des retournements mais pas sur l'amplitude, d'où l'échelle verticale libre. Les filtres passe-bande perdent des observations aux extrémités et le filtre HP est instable en fin d'échantillon, donc les derniers points du cycle sont les moins fiables.
Figure by James Wabenga Yango. Source: Central Bank of the Congo, World Bank, IMF; author’s calculations.Figure de James Wabenga Yango. Source : Banque centrale du Congo, Banque mondiale, FMI ; calculs de l’auteur.How to citeComment citer
Macroeconomic reading. For consumer prices, the HP cycle has a standard deviation of 4.78 percent, first-order autocorrelation 0.98, and correlation 0.22 with the output cycle. The five filters agree on the timing of turns more than on amplitude; the latest points are the least reliable.
Lecture macroéconomique. Pour les prix à la consommation, l'écart-type du cycle HP est de 4,78 % avec une autocorrélation d'ordre 1 de 0,98 et une corrélation de 0,22 avec le cycle de la production. Les cinq filtres s'accordent sur le calendrier des retournements plus que sur l'amplitude ; les derniers points sont les moins fiables.
Figure by James Wabenga Yango. Source: Central Bank of the Congo, World Bank, IMF; author’s calculations.Figure de James Wabenga Yango. Source : Banque centrale du Congo, Banque mondiale, FMI ; calculs de l’auteur.How to citeComment citer
Macroeconomic reading. For inflation, the five filters isolate the cyclical component of a monthly series. They agree on the timing of turns more than on amplitude, and the latest points are the least reliable; this series is not in the moments table, so the profile is read here rather than a quantified volatility.
Lecture macroéconomique. Pour l'inflation, les cinq filtres isolent la composante cyclique d'une série observée mensuellement. Ils s'accordent sur le calendrier des retournements plus que sur l'amplitude, et les derniers points sont les moins fiables ; cette série n'entre pas dans le tableau des moments, donc on lit ici le profil, non une volatilité chiffrée.
Figure by James Wabenga Yango. Source: Central Bank of the Congo, World Bank, IMF; author’s calculations.Figure de James Wabenga Yango. Source : Banque centrale du Congo, Banque mondiale, FMI ; calculs de l’auteur.How to citeComment citer
Macroeconomic reading. For the exchange rate, the HP cycle has a standard deviation of 5.58 percent, first-order autocorrelation 0.97, and correlation −0.14 with the output cycle. The five filters agree on the timing of turns more than on amplitude; the latest points are the least reliable.
Lecture macroéconomique. Pour le taux de change, l'écart-type du cycle HP est de 5,58 % avec une autocorrélation d'ordre 1 de 0,97 et une corrélation de −0,14 avec le cycle de la production. Les cinq filtres s'accordent sur le calendrier des retournements plus que sur l'amplitude ; les derniers points sont les moins fiables.
Figure by James Wabenga Yango. Source: Central Bank of the Congo, World Bank, IMF; author’s calculations.Figure de James Wabenga Yango. Source : Banque centrale du Congo, Banque mondiale, FMI ; calculs de l’auteur.How to citeComment citer
Macroeconomic reading. For broad money M2, the HP cycle has a standard deviation of 5.39 percent, first-order autocorrelation 0.89, and correlation 0.07 with the output cycle. The five filters agree on the timing of turns more than on amplitude; the latest points are the least reliable.
Lecture macroéconomique. Pour la masse monétaire M2, l'écart-type du cycle HP est de 5,39 % avec une autocorrélation d'ordre 1 de 0,89 et une corrélation de 0,07 avec le cycle de la production. Les cinq filtres s'accordent sur le calendrier des retournements plus que sur l'amplitude ; les derniers points sont les moins fiables.
Figure by James Wabenga Yango. Source: Central Bank of the Congo, World Bank, IMF; author’s calculations.Figure de James Wabenga Yango. Source : Banque centrale du Congo, Banque mondiale, FMI ; calculs de l’auteur.How to citeComment citer
Macroeconomic reading. For the policy rate, the five filters isolate the cyclical component of a monthly series. They agree on the timing of turns more than on amplitude, and the latest points are the least reliable; this series is not in the moments table, so the profile is read here rather than a quantified volatility.
Lecture macroéconomique. Pour le taux directeur, les cinq filtres isolent la composante cyclique d'une série observée mensuellement. Ils s'accordent sur le calendrier des retournements plus que sur l'amplitude, et les derniers points sont les moins fiables ; cette série n'entre pas dans le tableau des moments, donc on lit ici le profil, non une volatilité chiffrée.
Figure by James Wabenga Yango. Source: Central Bank of the Congo, World Bank, IMF; author’s calculations.Figure de James Wabenga Yango. Source : Banque centrale du Congo, Banque mondiale, FMI ; calculs de l’auteur.How to citeComment citer
Macroeconomic reading. For the federal funds rate, the five filters isolate the cyclical component of a monthly series. They agree on the timing of turns more than on amplitude, and the latest points are the least reliable; this series is not in the moments table, so the profile is read here rather than a quantified volatility.
Lecture macroéconomique. Pour le taux des fonds fédéraux, les cinq filtres isolent la composante cyclique d'une série observée mensuellement. Ils s'accordent sur le calendrier des retournements plus que sur l'amplitude, et les derniers points sont les moins fiables ; cette série n'entre pas dans le tableau des moments, donc on lit ici le profil, non une volatilité chiffrée.
Figure by James Wabenga Yango. Source: Central Bank of the Congo, World Bank, IMF; author’s calculations.Figure de James Wabenga Yango. Source : Banque centrale du Congo, Banque mondiale, FMI ; calculs de l’auteur.How to citeComment citer
Macroeconomic reading. For foreign reserves, the HP cycle has a standard deviation of 24.67 percent, first-order autocorrelation 0.84, and correlation 0.07 with the output cycle. The five filters agree on the timing of turns more than on amplitude; the latest points are the least reliable.
Lecture macroéconomique. Pour les réserves de change, l'écart-type du cycle HP est de 24,67 % avec une autocorrélation d'ordre 1 de 0,84 et une corrélation de 0,07 avec le cycle de la production. Les cinq filtres s'accordent sur le calendrier des retournements plus que sur l'amplitude ; les derniers points sont les moins fiables.
Figure by James Wabenga Yango. Source: Central Bank of the Congo, World Bank, IMF; author’s calculations.Figure de James Wabenga Yango. Source : Banque centrale du Congo, Banque mondiale, FMI ; calculs de l’auteur.How to citeComment citer
Macroeconomic reading. For the copper price, the HP cycle has a standard deviation of 9.77 percent, first-order autocorrelation 0.91, and correlation −0.08 with the output cycle. The five filters agree on the timing of turns more than on amplitude; the latest points are the least reliable.
Lecture macroéconomique. Pour le prix du cuivre, l'écart-type du cycle HP est de 9,77 % avec une autocorrélation d'ordre 1 de 0,91 et une corrélation de −0,08 avec le cycle de la production. Les cinq filtres s'accordent sur le calendrier des retournements plus que sur l'amplitude ; les derniers points sont les moins fiables.
Figure by James Wabenga Yango. Source: Central Bank of the Congo, World Bank, IMF; author’s calculations.Figure de James Wabenga Yango. Source : Banque centrale du Congo, Banque mondiale, FMI ; calculs de l’auteur.How to citeComment citer
Macroeconomic reading. For the trade balance, the five filters isolate the cyclical component of a monthly series. They agree on the timing of turns more than on amplitude, and the latest points are the least reliable; this series is not in the moments table, so the profile is read here rather than a quantified volatility.
Lecture macroéconomique. Pour la balance commerciale, les cinq filtres isolent la composante cyclique d'une série observée mensuellement. Ils s'accordent sur le calendrier des retournements plus que sur l'amplitude, et les derniers points sont les moins fiables ; cette série n'entre pas dans le tableau des moments, donc on lit ici le profil, non une volatilité chiffrée.
Figure by James Wabenga Yango. Source: Central Bank of the Congo, World Bank, IMF; author’s calculations.Figure de James Wabenga Yango. Source : Banque centrale du Congo, Banque mondiale, FMI ; calculs de l’auteur.How to citeComment citer
Figure by James Wabenga Yango. Source: Central Bank of the Congo, World Bank, IMF; author’s calculations.Figure de James Wabenga Yango. Source : Banque centrale du Congo, Banque mondiale, FMI ; calculs de l’auteur.How to citeComment citer
Macroeconomic reading. For consumption, the HP cycle has a standard deviation of 0.65 percent, first-order autocorrelation 0.98, and correlation 0.98 with the output cycle. The five filters agree on the timing of turns more than on amplitude; the latest points are the least reliable.
Lecture macroéconomique. Pour la consommation, l'écart-type du cycle HP est de 0,65 % avec une autocorrélation d'ordre 1 de 0,98 et une corrélation de 0,98 avec le cycle de la production. Les cinq filtres s'accordent sur le calendrier des retournements plus que sur l'amplitude ; les derniers points sont les moins fiables.
Figure by James Wabenga Yango. Source: Central Bank of the Congo, World Bank, IMF; author’s calculations.Figure de James Wabenga Yango. Source : Banque centrale du Congo, Banque mondiale, FMI ; calculs de l’auteur.How to citeComment citer
Macroeconomic reading. For investment, the HP cycle has a standard deviation of 2.67 percent, first-order autocorrelation 0.99, and correlation 0.89 with the output cycle. The five filters agree on the timing of turns more than on amplitude; the latest points are the least reliable.
Lecture macroéconomique. Pour l'investissement, l'écart-type du cycle HP est de 2,67 % avec une autocorrélation d'ordre 1 de 0,99 et une corrélation de 0,89 avec le cycle de la production. Les cinq filtres s'accordent sur le calendrier des retournements plus que sur l'amplitude ; les derniers points sont les moins fiables.
Figure by James Wabenga Yango. Source: Central Bank of the Congo, World Bank, IMF; author’s calculations.Figure de James Wabenga Yango. Source : Banque centrale du Congo, Banque mondiale, FMI ; calculs de l’auteur.How to citeComment citer
Macroeconomic reading. For exports, the HP cycle has a standard deviation of 1.79 percent, first-order autocorrelation 0.99, and correlation 0.89 with the output cycle. The five filters agree on the timing of turns more than on amplitude; the latest points are the least reliable.
Lecture macroéconomique. Pour les exportations, l'écart-type du cycle HP est de 1,79 % avec une autocorrélation d'ordre 1 de 0,99 et une corrélation de 0,89 avec le cycle de la production. Les cinq filtres s'accordent sur le calendrier des retournements plus que sur l'amplitude ; les derniers points sont les moins fiables.
Figure by James Wabenga Yango. Source: Central Bank of the Congo, World Bank, IMF; author’s calculations.Figure de James Wabenga Yango. Source : Banque centrale du Congo, Banque mondiale, FMI ; calculs de l’auteur.How to citeComment citer
Macroeconomic reading. For imports, the HP cycle has a standard deviation of 2.18 percent, first-order autocorrelation 0.99, and correlation 0.87 with the output cycle. The five filters agree on the timing of turns more than on amplitude; the latest points are the least reliable.
Lecture macroéconomique. Pour les importations, l'écart-type du cycle HP est de 2,18 % avec une autocorrélation d'ordre 1 de 0,99 et une corrélation de 0,87 avec le cycle de la production. Les cinq filtres s'accordent sur le calendrier des retournements plus que sur l'amplitude ; les derniers points sont les moins fiables.
Figure by James Wabenga Yango. Source: Central Bank of the Congo, World Bank, IMF; author’s calculations.Figure de James Wabenga Yango. Source : Banque centrale du Congo, Banque mondiale, FMI ; calculs de l’auteur.How to citeComment citer
Macroeconomic reading. For public revenue, the HP cycle has a standard deviation of 0.4 percent, first-order autocorrelation 0.99, and correlation 0.17 with the output cycle. The five filters agree on the timing of turns more than on amplitude; the latest points are the least reliable.
Lecture macroéconomique. Pour les recettes publiques, l'écart-type du cycle HP est de 0,4 % avec une autocorrélation d'ordre 1 de 0,99 et une corrélation de 0,17 avec le cycle de la production. Les cinq filtres s'accordent sur le calendrier des retournements plus que sur l'amplitude ; les derniers points sont les moins fiables.
Figure by James Wabenga Yango. Source: Central Bank of the Congo, World Bank, IMF; author’s calculations.Figure de James Wabenga Yango. Source : Banque centrale du Congo, Banque mondiale, FMI ; calculs de l’auteur.How to citeComment citer
Macroeconomic reading. For public spending, the HP cycle has a standard deviation of 0.23 percent, first-order autocorrelation 0.98, and correlation 0.39 with the output cycle. The five filters agree on the timing of turns more than on amplitude; the latest points are the least reliable.
Lecture macroéconomique. Pour les dépenses publiques, l'écart-type du cycle HP est de 0,23 % avec une autocorrélation d'ordre 1 de 0,98 et une corrélation de 0,39 avec le cycle de la production. Les cinq filtres s'accordent sur le calendrier des retournements plus que sur l'amplitude ; les derniers points sont les moins fiables.
Figure by James Wabenga Yango. Source: Central Bank of the Congo, World Bank, IMF; author’s calculations.Figure de James Wabenga Yango. Source : Banque centrale du Congo, Banque mondiale, FMI ; calculs de l’auteur.How to citeComment citer
Macroeconomic reading. For hours worked, the HP cycle has a standard deviation of 1.36 percent, first-order autocorrelation 0.98, and correlation 0.41 with the output cycle. The five filters agree on the timing of turns more than on amplitude; the latest points are the least reliable.
Lecture macroéconomique. Pour les heures travaillées, l'écart-type du cycle HP est de 1,36 % avec une autocorrélation d'ordre 1 de 0,98 et une corrélation de 0,41 avec le cycle de la production. Les cinq filtres s'accordent sur le calendrier des retournements plus que sur l'amplitude ; les derniers points sont les moins fiables.
ProcedureProcédure
How these panels are built. Each series is first put in the form a filter can take. A strictly positive series is replaced by a hundred times its natural logarithm, so that the deviation from trend reads directly as a percentage; a rate is already in percentage points and is filtered as it stands; a balance, which changes sign, admits no logarithm and is filtered in its own unit. The five filters are then applied to that same transformed series, and each panel shows the cyclical component one of them returns.Comment ces panneaux sont construits. Chaque série est d’abord mise sous la forme qu’un filtre peut prendre. Une série strictement positive est remplacée par cent fois son logarithme naturel, de sorte que l’écart à la tendance se lise directement en pourcentage ; un taux est déjà en points de pourcentage et se filtre tel quel ; un solde, qui change de signe, n’admet pas le logarithme et se filtre dans son unité propre. Les cinq filtres sont ensuite appliqués à cette même série transformée, et chaque panneau montre la composante cyclique que l’un d’eux restitue.
Hodrick-Prescott. The trend is the series that minimises the sum of squared deviations from the data plus λ times the sum of squared second differences of the trend itself; the cycle is what is left. The smoothing parameter is set to λ = 14400, the monthly counterpart of the quarterly 1600 under the fourth-power rule; the plate that follows shows what other values would have decided. The filter uses the whole sample and loses no observation, but the last points of the trend are estimated with data on one side only and move as the sample grows.Hodrick et Prescott. La tendance est la série qui minimise la somme des écarts au carré aux données, augmentée de λ fois la somme des carrés de ses propres différences secondes ; le cycle est ce qui reste. Le paramètre de lissage est fixé à λ = 14400, la contrepartie mensuelle du 1600 trimestriel selon la règle de la puissance quatre ; la planche suivante montre ce qu’auraient décidé d’autres valeurs. Le filtre utilise tout l’échantillon et ne perd aucune observation, mais les derniers points de la tendance sont estimés avec des données d’un seul côté et bougent à mesure que l’échantillon s’allonge.
Hamilton regression. The value observed h months ahead is regressed on a constant and on p successive lags of the series; the cycle is the residual of that regression, that is, the part of the future value that the recent past does not predict. The parameters are h = 24 and p = 12, the monthly transposition of the (8, 4) pair Hamilton recommends for quarterly data. The construction consumes the first h + p − 1 = 35 months, which is why this panel starts later than the others.Régression de Hamilton. On régresse la valeur observée h mois plus tard sur une constante et sur p retards successifs de la série ; le cycle est le résidu de cette régression, c’est-à-dire la part de la valeur future que le passé récent ne prédit pas. Les paramètres retenus sont h = 24 et p = 12, transposition mensuelle du couple (8, 4) que Hamilton recommande pour des données trimestrielles. La construction consomme les h + p − 1 = 35 premiers mois : c’est pourquoi ce panneau commence plus tard que les autres.
Band-pass filters. Both keep only the fluctuations whose period falls between 18 and 96 months, a year and a half to eight years, the range Burns and Mitchell assigned to the business cycle, and discard everything slower or faster. The Baxter-King filter is a symmetric moving average truncated at K = 36 months, which costs three years at each end of the sample; the Christiano-Fitzgerald filter is asymmetric, uses every observation and therefore loses none, at the price of weights that differ from one date to the next.Filtres passe-bande. Tous deux ne retiennent que les fluctuations dont la période tombe entre 18 et 96 mois, soit un an et demi à huit ans, l’intervalle que Burns et Mitchell assignaient au cycle des affaires, et rejettent tout ce qui est plus lent ou plus rapide. Le filtre de Baxter et King est une moyenne mobile symétrique tronquée à K = 36 mois, ce qui coûte trois ans à chaque extrémité de l’échantillon ; celui de Christiano et Fitzgerald est asymétrique, utilise toutes les observations et n’en perd donc aucune, au prix de pondérations qui diffèrent d’une date à l’autre.
First difference. The plainest cycle there is: the change from one month to the next, which removes any trend that is a straight line and keeps the rest. It loses only the first month. It is shown here because it assumes nothing, and because where it agrees with the other four the reading does not depend on the filter.Différence première. Le cycle le plus simple qui soit : la variation d’un mois à l’autre, qui retranche toute tendance linéaire et garde le reste. Elle ne perd que le premier mois. Elle figure ici parce qu’elle ne suppose rien, et parce que là où elle s’accorde avec les quatre autres, la lecture ne dépend pas du filtre.
Reading the panels. The vertical scale is free in each panel: the filters do not return comparable amplitudes, and forcing a common scale would flatten three of them. What is comparable, and what these plates are for, is the date of the turning points. Where the five panels turn together, the cycle is in the data; where they part, it is in the method. The shaded bands mark the episodes of macroeconomic stress, identical on every panel.Lire les panneaux. L’échelle verticale est libre dans chaque panneau : les filtres ne restituent pas des amplitudes comparables, et leur imposer une échelle commune en aplatirait trois. Ce qui est comparable, et ce à quoi ces planches servent, est la date des retournements. Là où les cinq panneaux se retournent ensemble, le cycle est dans les données ; là où ils divergent, il est dans la méthode. Les plages grisées signalent les épisodes de tension macroéconomique, identiques sur tous les panneaux.
The whole calculation is in tools/sf_prepare.py, in the standard library alone; each plate can be downloaded as an SVG from the line beneath it, and the table of moments under the five filters, higher up this pane, in CSV, XLSX or LaTeX. References: Hodrick and Prescott (1997); Hamilton (2018); Baxter and King (1999); Christiano and Fitzgerald (2003); Ravn and Uhlig (2002); Burns and Mitchell (1946).Tout le calcul tient dans tools/sf_prepare.py, avec la seule bibliothèque standard ; chaque planche se télécharge en SVG depuis la ligne qui la suit, et le tableau des moments sous les cinq filtres, plus haut dans ce volet, en CSV, XLSX ou LaTeX. Références : Hodrick et Prescott (1997) ; Hamilton (2018) ; Baxter et King (1999) ; Christiano et Fitzgerald (2003) ; Ravn et Uhlig (2002) ; Burns et Mitchell (1946).
Figure by James Wabenga Yango. Source: Central Bank of the Congo, World Bank, IMF; author’s calculations.Figure de James Wabenga Yango. Source : Banque centrale du Congo, Banque mondiale, FMI ; calculs de l’auteur.How to citeComment citer
Macroeconomic reading. The smoothing parameter arbitrates between trend and cycle: the larger it is, the straighter the trend and the larger the cycle's standard deviation. For monthly data 14,400 is the usual value (Ravn-Uhlig), but estimated cycle amplitude depends on this choice and is not comparable across studies.
Lecture macroéconomique. Le paramètre de lissage arbitre entre tendance et cycle : plus il est grand, plus la tendance est droite et plus l'écart-type du cycle augmente. Pour des données mensuelles, 14 400 est la valeur usuelle (Ravn-Uhlig), mais l'amplitude des cycles estimés dépend de ce choix et ne se compare pas d'une étude à l'autre.
Figure by James Wabenga Yango. Source: Observatory of Economic Complexity, 2024.Figure de James Wabenga Yango. Source : Observatory of Economic Complexity, 2024.How to citeComment citer
Macroeconomic reading. In 2024, refined copper (USD 19.5 billion), cobalt (3.05) and copper ore (3.03) dominate goods sales. An economy whose exports rest on two metals follows world price cycles (copper ranged from USD 4,472 per tonne in January 2016 to 10,231 in March 2022 in our series) with no short-run diversification lever. The weight of refined over ore indicates some local processing, which raises domestic value added, but declared figures may differ from partner statistics.
Lecture macroéconomique. En 2024, le cuivre raffiné (19,5 milliards de dollars), le cobalt (3,05) et le minerai de cuivre (3,03) dominent les ventes de biens. Une économie dont les exportations tiennent à deux métaux subit les cycles de prix mondiaux (le cuivre a oscillé entre 4 472 dollars la tonne en janvier 2016 et 10 231 en mars 2022 dans notre série) sans levier de diversification à court terme. Le poids du raffiné par rapport au minerai montre un début de transformation locale, qui augmente la valeur ajoutée captée sur place, mais les chiffres déclarés peuvent différer des statistiques des partenaires.
Figure by James Wabenga Yango. Source: IMF, World Bank, BCC, AfDB.Figure de James Wabenga Yango. Source : IMF, World Bank, BCC, AfDB.How to citeComment citer
Macroeconomic reading. The series falls into three regimes. From 1990 to 2002 output shrinks by 5.2 per cent a year on average (down to −13.5 per cent in 1993) and the real GDP index loses almost half its value, from 77 to 39.7 in 2001: a collapse of productive capacity, not an ordinary cycle. From 2003 to 2015 average growth reaches 7.2 per cent (peak 9.8 per cent in 2005), but part of that rate is catch-up from a very low base. Since 2016 the average falls back to 4.8 per cent, with sharp shocks: 0.4 per cent in 2016 (copper prices and political crisis), 0.8 per cent in 2020 (pandemic), then 9.3 per cent in 2022. Volatility remains that of an economy whose output depends on metal prices.
Lecture macroéconomique. La série se découpe en trois régimes. De 1990 à 2002, la production recule de 5,2 % par an en moyenne (jusqu'à −13,5 % en 1993) et l'indice du PIB réel perd près de la moitié de sa valeur, de 77 à 39,7 en 2001 : c'est un effondrement des capacités productives, et non un simple cycle. De 2003 à 2015, la croissance moyenne atteint 7,2 % (pic de 9,8 % en 2005), mais une part de ce taux est un rattrapage à partir d'un niveau très bas. Depuis 2016, la moyenne retombe à 4,8 %, avec des chocs nets : 0,4 % en 2016 (prix du cuivre et crise politique), 0,8 % en 2020 (pandémie), puis 9,3 % en 2022. La volatilité reste celle d'une économie dont la production dépend des cours des métaux.
Figure by James Wabenga Yango. Source: IMF, World Bank, BCC.Figure de James Wabenga Yango. Source : IMF, World Bank, BCC.How to citeComment citer
Macroeconomic reading. The logarithmic scale is essential: inflation from 1991 to 1994 (2,161, 4,136, 1,987, then 23,863 per cent) is hyperinflation, the kind produced by unconstrained monetary financing of the deficit when money stops serving as a store of value. The series minimum, 0.7 per cent in 2015, reflects stabilisation anchored on the dollar and tight monetary conditions. The rebound in 2017 (35.7 per cent) and 2018 (29.2 per cent) shows that this stability rested on fragile external and fiscal conditions. Inflation of 8.0 per cent in 2025 is moderate by the country's history but remains above the usual 3 to 5 per cent targets.
Lecture macroéconomique. L'échelle logarithmique est indispensable : l'inflation de 1991 à 1994 (2 161 %, 4 136 %, 1 987 %, puis 23 863 %) est une hyperinflation, du type que produit un financement monétaire du déficit sans contrainte, avec une monnaie qui cesse de servir de réserve de valeur. Le minimum de la série, 0,7 % en 2015, correspond à la stabilisation par ancrage sur le dollar et au gel de la monnaie. La reprise de 2017 (35,7 %) et de 2018 (29,2 %) montre que cette stabilité tenait à des conditions externes et budgétaires précaires. L'inflation de 8,0 % en 2025 est modérée au regard de l'histoire, mais reste supérieure aux cibles usuelles de 3 à 5 %.
Figure by James Wabenga Yango. Source: IMF, World Bank, BCC.Figure de James Wabenga Yango. Source : IMF, World Bank, BCC.How to citeComment citer
Macroeconomic reading. On a 2015 = 100 base the index bottoms in 2001 (39.7) and reaches 159 in 2025: real output gained 59 per cent in ten years, about 4.7 per cent a year, and is only 2.1 times its 1990 level (77 in 1990). The index regains its 1990 level only in 2012, which measures the cost of twelve lost years. Set against a population that has more than tripled since 1990, this aggregate level hides an income per head still below its 1960 value (see the output-per-head series).
Lecture macroéconomique. En base 2015 = 100, l'indice tombe à son plus bas en 2001 (39,7) et atteint 159 en 2025 : la production réelle a gagné 59 % en dix ans, soit environ 4,7 % par an, et ne vaut que 2,1 fois son niveau de 1990 (77 en 1990). L'indice ne retrouve son niveau de 1990 qu'en 2012, ce qui mesure le coût de douze années perdues. Rapporté à une population qui a plus que triplé depuis 1990, ce niveau agrégé masque un revenu par habitant encore inférieur à celui de 1960 (voir la série du produit par habitant).
Figure by James Wabenga Yango. Source: Banque Centrale du Congo, Monetary Policy Committee.Figure de James Wabenga Yango. Source : Banque Centrale du Congo, Monetary Policy Committee.How to citeComment citer
Macroeconomic reading. The central bank raised its policy rate from 11 to 25 per cent in August 2023, a tightening of 14 points against franc depreciation and inflation. Since October 2025 it has come down in steps: 17.5, 15, 13.5 and then 12.5 per cent in July 2026, 12.5 points of easing in all. With inflation projected at 6.5 per cent for 2026, the ex ante real rate stays positive by about 6 points: policy is restrictive, though less than in 2023-2025. A policy rate acts here on a heavily dollarised economy, where the franc credit channel is narrow; the effect works mainly through the exchange rate and expectations.
Lecture macroéconomique. La banque centrale a porté son taux directeur de 11 % à 25 % en août 2023, un resserrement de 14 points face à la dépréciation du franc et à l'inflation. Depuis octobre 2025, il redescend par paliers : 17,5 %, 15 %, 13,5 % puis 12,5 % en juillet 2026, soit 12,5 points d'assouplissement. Avec une inflation projetée à 6,5 % pour 2026, le taux réel ex ante reste positif d'environ 6 points : la politique est restrictive, mais moins qu'en 2023-2025. Un taux directeur agit ici sur une économie très dollarisée, où le canal du crédit en francs est étroit ; l'effet passe surtout par le taux de change et les anticipations.
Figure by James Wabenga Yango. Source: OCHA and Institut national de la statistique, Humanitarian Data Exchange.Figure de James Wabenga Yango. Source : OCHA and Institut national de la statistique, Humanitarian Data Exchange.How to citeComment citer
Demographic reading. Kinshasa has a projected 9.9 million inhabitants in 2026, nearly three times Mbuji-Mayi (3.4 million): a clear primacy. But the map is not only the capital: four of the fifteen entities are in North Kivu (Masisi, Rutshuru, Lubero, Oïcha) and two in Ituri (Djugu, Mahagi), that is, in the conflict zone. These projections rest on old censuses and are best read as orders of magnitude; they mostly serve to size needs for services (health, school, water) and to avoid confusing market size with the state's capacity to serve it.
Lecture démographique. Kinshasa compte 9,9 millions d'habitants projetés en 2026, près de trois fois Mbuji-Mayi (3,4 millions) : une primatie nette. Mais la carte ne se réduit pas à la capitale : quatre des quinze entités sont au Nord-Kivu (Masisi, Rutshuru, Lubero, Oïcha) et deux en Ituri (Djugu, Mahagi), c'est-à-dire dans la zone de conflit. Ces projections, fondées sur des recensements anciens, sont à lire comme des ordres de grandeur ; elles servent surtout à dimensionner les besoins de services (santé, école, eau) et à ne pas confondre taille de marché et capacité de l'État à les servir.
Figure by James Wabenga Yango. Source: World Bank, Commodity Markets Outlook, monthly historical workbook.Figure de James Wabenga Yango. Source : World Bank, Commodity Markets Outlook, monthly historical workbook.How to citeComment citer
Macroeconomic reading. In current dollars, copper reaches its highest annual average of the series in 2025, $9,947 a tonne, against $679 in 1960; in real terms the gap is much smaller, and the useful comparison is across cycles: trough of 2015 ($5,510), 2011 peak ($8,828), 2025 peak. The annual change in copper has a standard deviation of about 22 per cent (in logarithms), which quantifies the fiscal and external exposure: an economy that draws most of its exports from one metal with this volatility takes income shocks that only a fiscal rule or a stabilisation fund can absorb.
Lecture macroéconomique. En dollars courants, le cuivre atteint en 2025 sa moyenne annuelle la plus haute de la série, 9 947 $ la tonne, contre 679 $ en 1960 ; mais en termes réels l'écart est bien moindre, et la comparaison utile est celle des cycles : creux de 2015-2016 (5 510 $ en 2015), pic de 2011 (8 828 $), pic de 2025. La variation annuelle du cuivre a un écart-type d'environ 22 % (en logarithme), ce qui chiffre l'exposition budgétaire et externe : une économie qui tire l'essentiel de ses exportations d'un métal à ce niveau de volatilité subit des chocs de revenu que seule une règle budgétaire ou un fonds de stabilisation peuvent absorber.
Figure by James Wabenga Yango. Source: World Bank Pink Sheet, Fastmarkets, press.Figure de James Wabenga Yango. Source : World Bank Pink Sheet, Fastmarkets, press.How to citeComment citer
Macroeconomic reading. For an exporter of copper, cobalt, tin and gold, the terms of trade improve markedly: against the 2025 average, copper gains 45.5 per cent, tin 57.7, gold 25.5 and zinc 40.2. Brent, at +69.2 per cent, works the other way since the country imports its fuel. Cash crops fall (cocoa −24.1 per cent, arabica −14.3, robusta −24.1). The expected effect is higher extractive revenue and reserves, but it passes through mining taxation and the split between exports and spending, not automatically through household income. The readings carry different dates (see the 'As at' column).
Lecture macroéconomique. Pour un exportateur de cuivre, de cobalt, d'étain et d'or, les termes de l'échange s'améliorent nettement : par rapport à la moyenne de 2025, le cuivre gagne 45,5 %, l'étain 57,7 %, l'or 25,5 % et le zinc 40,2 %. Le Brent, à +69,2 %, joue en sens inverse, puisque le pays importe ses produits pétroliers. Les cultures de rente reculent (cacao −24,1 %, café arabica −14,3 %, robusta −24,1 %). L'effet attendu est une hausse des recettes extractives et des réserves, mais il passe par la fiscalité minière et la répartition entre exportations et dépenses, pas automatiquement par le revenu des ménages. Les relevés ont des dates différentes (voir la colonne « À la date »).
Figure by James Wabenga Yango. Source: World Bank, World Development Indicators; author's calculations.Figure de James Wabenga Yango. Source : Banque mondiale, World Development Indicators ; calculs de l’auteur.How to citeComment citer
Macroeconomic reading. The franc goes from 207 per dollar in 2001 to 2,693 in 2025, a 92 percent loss of value in twenty-four years (11 percent a year on average). It moves in steps: near stability at 906 to 926 from 2010 to 2015, a break in 2016-2017 (1,010 then 1,464) with the copper slump, then steady slide. Before 2000 the series (restated in current francs after redenominations) is not comparable: from 1960 to 1999 it goes from 10 to the minus 13 to 4, a cumulative depreciation above 10 to the 13th, reflecting money financing and hyperinflation in 1990 to 1998.
Lecture macroéconomique. Le franc passe de 207 pour un dollar en 2001 à 2 693 en 2025, soit une dépréciation de 92 % de sa valeur en vingt-quatre ans (11 % par an en moyenne). Elle se fait par paliers : quasi-stabilité à 906-926 de 2010 à 2015, rupture en 2016-2017 (1 010 puis 1 464) avec la chute du cuivre, puis glissement continu. Avant 2000 la série (convertie en francs actuels après redénominations) n'a pas de sens pour la comparaison : de 1960 à 1999 elle va de 10⁻¹³ à 4, signe d'une dépréciation cumulée de plus de 10¹³, qui illustre la monétisation et l'hyperinflation de 1990 à 1998.
Figure by James Wabenga Yango. Source: World Bank, World Development Indicators; author's calculations.Figure de James Wabenga Yango. Source : Banque mondiale, World Development Indicators ; calculs de l’auteur.How to citeComment citer
Macroeconomic reading. Primary completion rises from 42 percent in 1971 to 67 percent in 1984, falls to 49 percent in 1988 and 33 percent in 1999 (the series low) during the collapse of the state and the wars, then climbs to 59 percent in 2010, 81 percent in 2021 and 76 percent in 2023. The sharp rise from 2015 to 2021 coincides with the free primary schooling decreed in 2019, but a completion rate measures access, not learning quality. Gross secondary enrolment stays near 23 to 25 percent from 1980 to 1995, then reaches 55 percent in 2023: cohorts born after 2000 are much better schooled, which raises human capital if quality follows. Public education spending, available for few years, goes from 2.3 percent of GDP in 1980 to 0.7 in 1986, then 1.5 percent in 2010 and 2.8 in 2022. Missing years are joined by straight segments; a line between distant years is not an observation.
Lecture macroéconomique. Le taux d'achèvement du primaire monte de 42 % en 1971 à 67 % en 1984, retombe à 49 % en 1988 et à 33 % en 1999 (plancher de la série) pendant l'effondrement de l'État et les guerres, puis remonte à 59 % en 2010, 81 % en 2021 et 76 % en 2023. La forte hausse de 2015 à 2021 coïncide avec la gratuité du primaire décrétée en 2019, mais un taux d'achèvement mesure l'accès, non la qualité des apprentissages. La scolarisation secondaire brute reste proche de 23-25 % de 1980 à 1995, puis atteint 55 % en 2023 : les générations nées après 2000 sont beaucoup plus scolarisées, ce qui se traduira par un capital humain plus élevé si la qualité suit. La dépense publique d'éducation, disponible pour peu d'années, passe de 2,3 % du PIB en 1980 à 0,7 % en 1986, puis 1,5 % en 2010 et 2,8 % en 2022. Les points manquants sont reliés par des segments : une droite entre deux années éloignées n'est pas une observation.
Figure by James Wabenga Yango. Source: World Bank, World Development Indicators; author's calculations.Figure de James Wabenga Yango. Source : Banque mondiale, World Development Indicators ; calculs de l’auteur.How to citeComment citer
Macroeconomic reading. Life expectancy rises from 40.8 years in 1960 to 62.1 in 2024, a gain of 21 years in 64, but unevenly: flat around 40 to 45 until 1975, 48.5 in 1990, dips in 1996 (49.4) and 1998 (49.7) during the wars, then roughly 0.4 years gained per year since 2003. The only recent fall, from 60.4 to 60.0 in 2021, matches the pandemic. Such low longevity limits human capital and labour productivity. The World Bank series is modelled from few surveys, so year-to-year gaps should be read with caution.
Lecture macroéconomique. L'espérance de vie passe de 40,8 ans en 1960 à 62,1 ans en 2024, soit 21 ans de gain en 64 ans, mais le gain est inégal : elle stagne autour de 40-45 ans jusqu'en 1975, progresse lentement à 48,5 ans en 1990, recule en 1996 (49,4) et 1998 (49,7) pendant les guerres, puis gagne environ 0,4 an par année depuis 2003. Le seul recul récent, de 60,4 à 60,0 ans en 2021, correspond à la pandémie. Une longévité aussi basse limite le capital humain et la productivité de la main-d'œuvre. Séries modélisées par la Banque mondiale à partir de peu d'enquêtes : les écarts annuels sont à lire avec prudence.
Figure by James Wabenga Yango. Source: World Bank, World Development Indicators; author's calculations.Figure de James Wabenga Yango. Source : Banque mondiale, World Development Indicators ; calculs de l’auteur.How to citeComment citer
Macroeconomic reading. The total fertility rate stays between 6.1 and 6.7 children per woman for sixty years: 6.1 in 1960, a peak of 6.70 in 2000, 5.98 in 2024. The decline began only after 2012 and amounts to less than 0.6 child. Such stable fertility underlies population growth near 3 percent a year (see GDP per head) and a very high dependency ratio: the demographic transition that opens a demographic dividend elsewhere has not started in any significant way.
Lecture macroéconomique. L'indice de fécondité reste entre 6,1 et 6,7 enfants par femme pendant soixante ans : 6,1 en 1960, pic à 6,70 en 2000, 5,98 en 2024. La baisse n'a commencé qu'après 2012 et ne dépasse pas 0,6 enfant. Une fécondité aussi stable explique une croissance de la population de près de 3 % par an (voir le PIB par habitant) et un rapport de dépendance très élevé : la transition démographique, qui ouvre ailleurs un dividende démographique, n'est pas engagée ici de manière notable.
Figure by James Wabenga Yango. Source: World Bank, World Development Indicators; author's calculations.Figure de James Wabenga Yango. Source : Banque mondiale, World Development Indicators ; calculs de l’auteur.How to citeComment citer
Macroeconomic reading. Central government revenue (grants included) goes from 10.0 percent of GDP in 1990 to 0.8 percent in 2000, the low, then rises to 14.0 percent in 2009 (the peak) and settles near 8 to 10 percent from 2016 to 2021, before jumping to 13.2 percent in 2022. Tax revenue follows at a lower level: 0.8 percent in 2000, 7.9 in 2009, 7.0 in 2019, 10.7 in 2022. Expenditure runs from 16.7 percent of GDP in 1991 to 2.0 in 2000, then 13.9 in 2012 and 12.4 in 2022. Three facts: the state collapsed in 1990 to 2000 (spending cut eightfold), recovery came through revenue (grants included) rather than a broad tax base, and in 2022 the balance is a small surplus of about 0.8 points of GDP after a jump in revenue. A tax burden near ten points of GDP leaves little room to fund infrastructure and schooling. The ratios use revised GDP, so levels compare poorly across base years. The year 2011 is missing.
Lecture macroéconomique. Les recettes de l'administration centrale (dons compris) passent de 10,0 % du PIB en 1990 à 0,8 % en 2000, le point le plus bas, puis remontent à 14,0 % en 2009 (année du pic) et se stabilisent autour de 8 à 10 % de 2016 à 2021, avant un bond à 13,2 % en 2022. Les recettes fiscales suivent à un niveau plus bas : 0,8 % en 2000, 7,9 % en 2009, 7,0 % en 2019, 10,7 % en 2022. Les dépenses vont de 16,7 % du PIB en 1991 à 2,0 % en 2000, puis 13,9 % en 2012 et 12,4 % en 2022. Trois faits : l'État s'est effondré en 1990-2000 (dépenses divisées par huit), le redressement s'est fait par les recettes (dont les dons) plutôt que par une base fiscale large, et en 2022 le solde est un léger excédent, d'environ 0,8 point de PIB, après un bond des recettes. Une pression fiscale d'environ dix points de PIB laisse peu de marge pour financer les infrastructures et l'éducation. Le ratio est calculé sur un PIB révisé : les niveaux se comparent mal d'une année de base à l'autre. L'année 2011 manque dans la série.
Figure by James Wabenga Yango. Source: World Bank, World Development Indicators; author's calculations.Figure de James Wabenga Yango. Source : Banque mondiale, World Development Indicators ; calculs de l’auteur.How to citeComment citer
Macroeconomic reading. External debt rises from USD 0.35 billion in 1970 to 13.2 in 1995 and stays near 12 until 2009; it falls to 5.7 in 2010 with relief at the HIPC completion point, then climbs back to 12.5 in 2024, the pre-relief level. Net FDI, small and often negative from 1982 to 1999, reaches 1.8 billion in 2007 and 2.9 in 2024, flowing into mining with little spillover. Debt has returned to its pre-relief level without diversification of the productive base, which calls for vigilance on sustainability.
Lecture macroéconomique. L'encours de la dette extérieure monte de 0,35 milliard de dollars en 1970 à 13,2 en 1995 et reste autour de 12 jusqu'en 2009 ; il chute à 5,7 en 2010 avec l'allègement obtenu au point d'achèvement de l'initiative PPTE, puis remonte à 12,5 en 2024, de nouveau au niveau d'avant l'allègement. Les IDE nets, petits et souvent négatifs de 1982 à 1999, passent à 1,8 milliard en 2007 et 2,9 en 2024 : ils entrent dans le secteur minier avec peu de retombées sur le reste de l'économie. La dette retrouve son niveau d'avant allègement sans que la base productive se soit diversifiée, ce qui justifie une vigilance sur la soutenabilité.
Figure by James Wabenga Yango. Source: World Bank, World Development Indicators; author's calculations.Figure de James Wabenga Yango. Source : Banque mondiale, World Development Indicators ; calculs de l’auteur.How to citeComment citer
Macroeconomic reading. Industry's share of GDP, mining included, goes from 16 percent in 1994 to 32 percent in 2002 and 42 percent in 2021, then 40 percent in 2025; manufacturing climbs to about 16 percent in 2012 to 2015 and falls to 7.9 percent in 2025. The economy industrialises only in the extractive sense: value added grows with mining while local processing recedes, a sign of relative deindustrialisation. Manufacturing figures before 2010 (21 percent in 2002, 5.5 in 2010) show series and base breaks, so they serve for the overall profile, not the value of a given year. This confirms mining dependence without diversification (see export composition).
Lecture macroéconomique. La part de l'industrie, mines comprises, dans le PIB passe de 16 % en 1994 à 32 % en 2002 et 42 % en 2021, puis 40 % en 2025 ; la part de la manufacture, elle, monte à environ 16 % en 2012-2015 et retombe à 7,9 % en 2025. L'économie s'industrialise donc seulement au sens extractif : la valeur ajoutée croît avec les mines, tandis que la transformation locale recule, signe d'une désindustrialisation relative. Les chiffres de manufacture avant 2010 (21 % en 2002, 5,5 % en 2010) montrent des ruptures de série et de base de calcul : ils servent à lire le profil d'ensemble, non la valeur d'une année. Cela confirme la thèse d'une dépendance minière sans diversification (voir la composition des exportations).
Figure by James Wabenga Yango. Source: World Bank, World Development Indicators; author's calculations.Figure de James Wabenga Yango. Source : Banque mondiale, World Development Indicators ; calculs de l’auteur.How to citeComment citer
Macroeconomic reading. Under-five mortality falls from 248 per 1,000 in 1969 to 89.7 in 2024, a factor of 2.8. Two breaks: a rise to 210 in 1996 (wars) and a drop from 159 to 124 in 2005 too large for a one-year improvement and probably due to a new survey source. Since 2015 the series stalls near 92: the easy gains (vaccination, rehydration) are done, and further progress depends on access to care and nutrition.
Lecture macroéconomique. La mortalité des moins de cinq ans baisse de 248 pour 1 000 en 1969 à 89,7 en 2024, soit une division par 2,8. Deux ruptures : une hausse à 210 en 1996 (guerres), et une chute de 159 à 124 en 2005, dont l'ampleur est trop forte pour une amélioration d'une seule année et vient probablement d'une nouvelle source d'enquête. Depuis 2015 la série stagne vers 92 : les gains faciles (vaccination, réhydratation) sont acquis, et le progrès suivant dépend de l'accès aux soins et de la nutrition.
Figure by James Wabenga Yango. Source: World Bank, World Development Indicators; author's calculations.Figure de James Wabenga Yango. Source : Banque mondiale, World Development Indicators ; calculs de l’auteur.How to citeComment citer
Macroeconomic reading. Trade in goods and services (exports plus imports) runs from 25 percent of GDP in 2001 to 94 percent in 2024. Openness doubles after 2002 with the mining recovery and surges since 2021 (75 percent) with copper and cobalt. The high ratio reflects a mining-concentrated export base and matching imports of consumer and capital goods rather than diversified integration, so exposure to the terms of trade is large.
Lecture macroéconomique. Le commerce de biens et services (exportations plus importations) représente entre 25 % du PIB en 2001 et 94 % en 2024. L'ouverture double après 2002 avec la reprise minière, puis s'envole depuis 2021 (75 %) avec le cuivre et le cobalt. Ce ratio élevé reflète moins une intégration diversifiée qu'une économie dont l'exportation est concentrée dans les mines et dont les importations de biens de consommation et d'équipement sont proportionnelles : la vulnérabilité aux termes de l'échange est donc forte.
Figure by James Wabenga Yango. Source: World Bank, World Development Indicators; author's calculations.Figure de James Wabenga Yango. Source : Banque mondiale, World Development Indicators ; calculs de l’auteur.How to citeComment citer
Macroeconomic reading. Reserves stay below USD 0.5 billion from 1960 to 2008 (maximum 0.45 in 1986), fall to 0.05 in 1993 during hyperinflation, then exceed 1 billion in 2009, 3.5 in 2021 and 5.1 in 2023. They track the mining cycle and donor disbursements (SDR allocations in 2009 and 2021), not accumulation from a current account surplus. The World Bank series ends in 2023.
Lecture macroéconomique. Les réserves restent sous 0,5 milliard de dollars de 1960 à 2008 (maximum 0,45 en 1986), tombent à 0,05 en 1993 pendant l'hyperinflation, puis dépassent 1 milliard en 2009, 3,5 en 2021 et 5,1 en 2023. Elles suivent le cycle minier et les décaissements des bailleurs (allocation de DTS en 2009 et 2021), non une accumulation par excédent courant. La série Banque mondiale s'arrête en 2023.
Figure by James Wabenga Yango. Source: World Bank, World Development Indicators; author's calculations.Figure de James Wabenga Yango. Source : Banque mondiale, World Development Indicators ; calculs de l’auteur.How to citeComment citer
Macroeconomic reading. Current health expenditure, all sources, goes from 1.5 percent of GDP in 2000 to 4.5 percent in 2009, falls to 3.2 percent in 2011, rises to 4.2 percent in 2016 and stands at 3.7 percent in 2023. It does not fall as GDP grows, but with very low GDP per head, spending per person is also very low: a stable share of GDP does not mean adequate resources. The series adds household, donor and government payments and does not say who pays; it should be read with life expectancy and child mortality, which have not progressed since 2015.
Lecture macroéconomique. La dépense courante de santé, toutes sources confondues, passe de 1,5 % du PIB en 2000 à 4,5 % en 2009, redescend à 3,2 % en 2011, remonte à 4,2 % en 2016 et reste à 3,7 % en 2023. Elle ne baisse pas avec la croissance du PIB, mais le PIB par habitant étant très bas, la dépense par personne l'est aussi : une part de PIB stable ne signifie pas des moyens suffisants. Cette série totalise les paiements des ménages, des bailleurs et de l'État et ne dit pas qui paie ; elle doit se lire avec l'espérance de vie et la mortalité des enfants, qui n'ont pas progressé depuis 2015.
The tables and the plates of this section are compiled and drawn by the author from published sources. If one of them supports a piece of your own work (an article, a thesis, a report, a lecture, a slide), please cite it. The reference below covers the whole collection; the example further down shows how to point at a single figure or a single table.
Les tableaux et les planches de cette section sont composés et tracés par l’auteur à partir de sources publiées. Si l’un d’eux vient appuyer un travail (article, thèse, rapport, cours, diapositive), merci de le citer. La référence ci-dessous couvre l’ensemble ; l’exemple plus bas montre comment viser une figure ou un tableau en particulier.
BibTeXBibTeX
@misc{wabengayango2026drc,
  author       = {Wabenga Yango, James},
  title        = {Democratic Republic of the Congo: macroeconomic data,
                  figures and stylised facts},
  year         = {2026},
  version      = {August 2026},
  howpublished = {\url{https://jamwab.github.io}},
  url          = {https://jamwab.github.io/#drc},
  note         = {ORCID 0000-0002-4675-4583}
}
APA, seventh editionAPA, septième édition
Wabenga Yango, J. (2026). Democratic Republic of the Congo: macroeconomic
    data, figures and stylised facts (Version August 2026) [Data set].
    https://jamwab.github.io/#drc
Chicago, author–dateChicago, auteur-date
Wabenga Yango, James. 2026. "Democratic Republic of the Congo:
    Macroeconomic Data, Figures and Stylised Facts." Version August 2026.
    https://jamwab.github.io/#drc.
A single figure or tableUne figure ou un tableau en particulier
Each plate and each table carries an identifier, visible in the address bar once you follow its How to cite link. Append it to the address and add the title:
Chaque planche et chaque tableau porte un identifiant, lisible dans la barre d’adresse dès que l’on suit son renvoi Comment citer. Il suffit de l’ajouter à l’adresse, avec le titre :
Wabenga Yango, J. (2026). One cycle, five filters [Figure].
    https://jamwab.github.io/#fig-sf-filtres

Wabenga Yango, J. (2026). Business cycle moments, DR Congo [Table].
    https://jamwab.github.io/#tab-sf-moments
The date of consultation matters: the series are refreshed nightly and a figure read today may differ from the same figure read next month. Note the version, August 2026, or the day you consulted the page.La date de consultation compte : les séries sont actualisées chaque nuit et un chiffre lu aujourd’hui peut différer du même chiffre lu le mois prochain. Indiquez la version, août 2026, ou le jour de votre consultation.
Contact
Get in touchMe joindre
I am glad to hear from co-authors, students and anyone working on demographics, external balances or monetary policy in open economies.
J’accueille volontiers les messages de coauteurs, d’étudiants et de toute personne travaillant sur la démographie, les soldes extérieurs ou la politique monétaire en économie ouverte.