Migration and remittancesMigrations et envois de fonds
Two million abroad, one million withinDeux millions dehors, un million dedans
Some two million Congolese live outside the country and about the same number of foreigners live inside it, which makes the DRC one of the few African states that is simultaneously a large sender, a large host and a large producer of refugees. The money that follows those people home is now worth two to three billion dollars a year, of the same order as the entire mining tax take, and it is counted with far less precision. Internal movement is the gap in this section, and it is a real one: there has been no census since 1984, so no inter-provincial migration matrix exists to be reproduced here.
Quelque deux millions de Congolais vivent hors du pays et à peu près autant d’étrangers y vivent, ce qui fait de la RD Congo l’un des rares États africains à être en même temps un grand pays de départ, un grand pays d’accueil et un grand producteur de réfugiés. L’argent qui suit ces personnes jusqu’au pays vaut aujourd’hui deux à trois milliards de dollars l’an, du même ordre que la totalité des recettes minières, et il est compté avec bien moins de précision. Le mouvement interne est le manque de cette section, et c’est un manque réel : aucun recensement depuis 1984, donc aucune matrice de migration interprovinciale à reproduire ici.
Personal remittances receivedEnvois de fonds des migrants reçus
Figure by James Wabenga Yango. Source: Banque mondiale, World Development Indicators, séries BX.TRF.PWKR.CD.DT et BX.TRF.PWKR.DT.GD.ZS, d’après les statistiques de balance des paiements du FMI ; millésime de la base du 13 juillet 2026.Figure de James Wabenga Yango. Source : Banque mondiale, World Development Indicators, séries BX.TRF.PWKR.CD.DT et BX.TRF.PWKR.DT.GD.ZS, d’après les statistiques de balance des paiements du FMI ; millésime de la base du 13 juillet 2026.How to citeComment citer
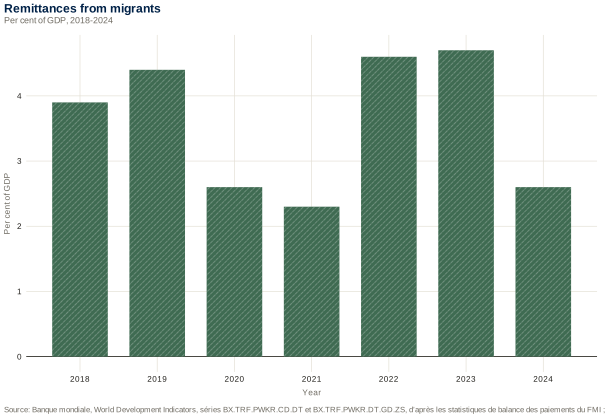
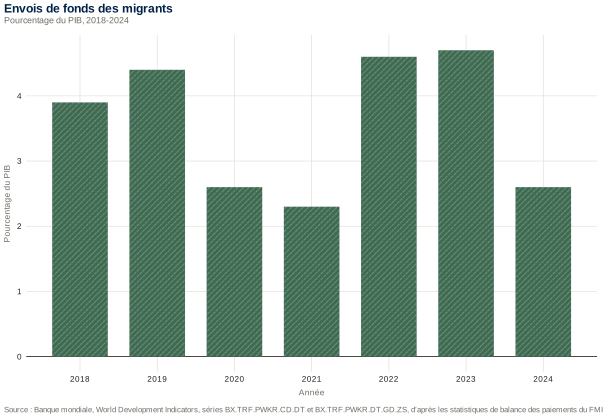
Remittances are the second largest current inflow after mineral exports, and at their 2023 peak they were worth about half of foreign direct investment. The series is not smooth and this page does not smooth it: it falls by a third in 2020, roughly triples between 2021 and 2022, and falls by two fifths again in 2024. The Bank publishes no revision note that would let a reader say which of the flow or its measurement changed, so the jumps are printed as they stand. The figures are Fund balance of payments data completed by Bank staff estimates, which is to say that informal transfers, believed to be large in the DRC, are captured only to the extent that the estimate captures them.Les envois de fonds sont la deuxième entrée courante après les exportations minières, et à leur sommet de 2023 ils valaient environ la moitié de l’investissement direct étranger. La série n’est pas lisse et cette page ne la lisse pas : elle recule d’un tiers en 2020, à peu près triple entre 2021 et 2022, et retombe de deux cinquièmes en 2024. La Banque ne publie aucune note de révision qui permettrait de dire ce qui, du flux ou de sa mesure, a changé : les sauts sont donc imprimés tels quels. Les chiffres sont des données de balance des paiements du Fonds complétées par des estimations des services de la Banque, c’est-à-dire que les transferts informels, réputés importants en RD Congo, n’y sont saisis que dans la mesure où l’estimation les saisit.
Source:Source : Banque mondiale, World Development Indicators, séries BX.TRF.PWKR.CD.DT et BX.TRF.PWKR.DT.GD.ZS, d’après les statistiques de balance des paiements du FMI ; millésime de la base du 13 juillet 2026.
Table compiled by James Wabenga Yango.Tableau composé par James Wabenga Yango.How to citeComment citer
Congolese-born people living abroad, 2024Personnes nées en RD Congo vivant à l’étranger, 2024
Figure by James Wabenga Yango. Source: Nations unies, Département des affaires économiques et sociales, International Migrant Stock 2024 (POP/DB/MIG/Stock/Rev.2024), publié en janvier 2025.Figure de James Wabenga Yango. Source : Nations unies, Département des affaires économiques et sociales, International Migrant Stock 2024 (POP/DB/MIG/Stock/Rev.2024), publié en janvier 2025.How to citeComment citer
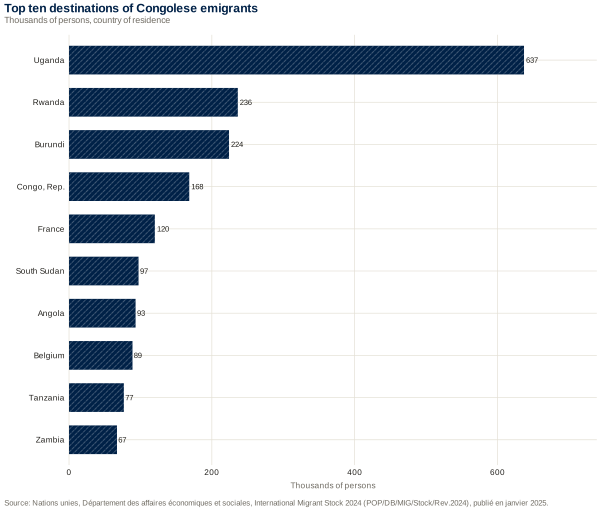
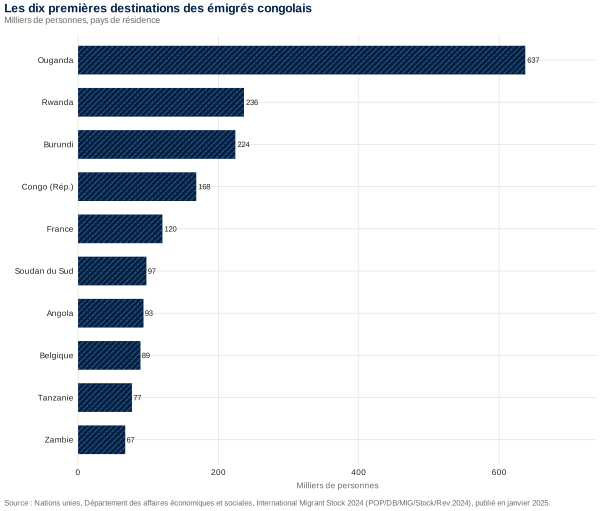
The Congolese diaspora numbered 2.10 million in mid-2024, against 1.92 million in 2020. The thirteen countries listed hold about ninety-three per cent of it. The geography deserves a second look: eleven of the thirteen are African and the four largest are immediate neighbours, so most Congolese emigration is regional and much of it is displacement that has settled. France, Belgium and Canada together hold about a eighth of the total, which is the part of the diaspora that the remittance series above mostly reflects.La diaspora congolaise comptait 2,10 millions de personnes à la mi-2024, contre 1,92 million en 2020. Les treize pays énumérés en portent environ quatre-vingt-treize pour cent. La géographie mérite un second regard : onze des treize sont africains et les quatre premiers sont des voisins immédiats, de sorte que l’essentiel de l’émigration congolaise est régional et qu’une bonne part en est un déplacement qui s’est installé. La France, la Belgique et le Canada réunis en portent environ un huitième, et c’est cette part de la diaspora que reflète surtout la série d’envois de fonds ci-dessus.
Source:Source : Nations unies, Département des affaires économiques et sociales, International Migrant Stock 2024 (POP/DB/MIG/Stock/Rev.2024), publié en janvier 2025.
Table compiled by James Wabenga Yango.Tableau composé par James Wabenga Yango.How to citeComment citer
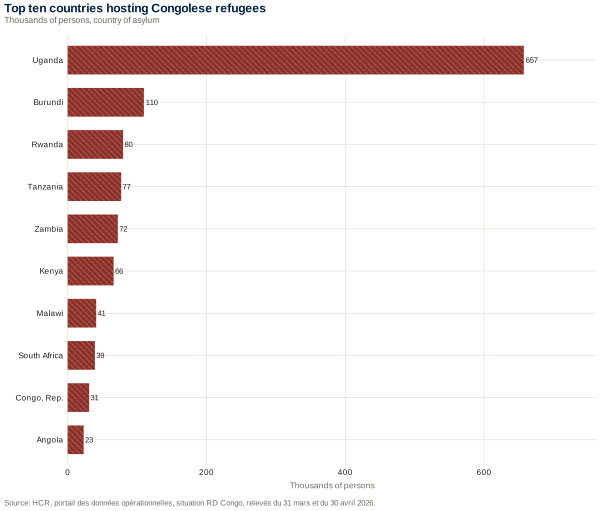
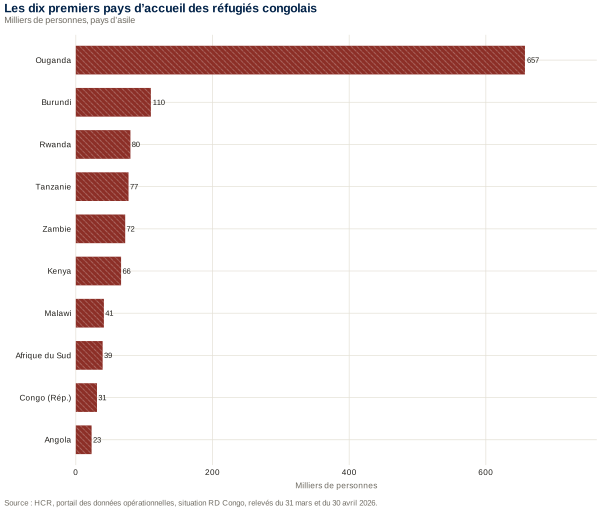
Congolese refugees and asylum seekers, by country of asylumRéfugiés et demandeurs d’asile congolais, par pays d’asile
Figure by James Wabenga Yango. Source: HCR, portail des données opérationnelles, situation RD Congo, relevés du 31 mars et du 30 avril 2026.Figure de James Wabenga Yango. Source : HCR, portail des données opérationnelles, situation RD Congo, relevés du 31 mars et du 30 avril 2026.How to citeComment citer
Read this table against the one above it. Of the 2.10 million Congolese living abroad, 1.24 million are registered as refugees or asylum seekers, and 657 thousand of those are in Uganda alone: more than half of the Congolese refugee population is in one country, and the Ugandan figure comes from the government rather than from the agency. The portal covers African countries of asylum only, so the total is a floor and not a world count. Figures are dated 31 March 2026, except Malawi, South Sudan and the total, which are dated 30 April 2026.Ce tableau se lit contre celui qui le précède. Sur les 2,10 millions de Congolais vivant à l’étranger, 1,24 million sont enregistrés comme réfugiés ou demandeurs d’asile, et 657 mille d’entre eux se trouvent en Ouganda seul : plus de la moitié de la population réfugiée congolaise tient dans un seul pays, et le chiffre ougandais provient du gouvernement et non de l’agence. Le portail ne couvre que les pays d’asile africains : le total est donc un plancher et non un décompte mondial. Les chiffres sont arrêtés au 31 mars 2026, sauf le Malawi, le Soudan du Sud et le total, arrêtés au 30 avril 2026.
Source:Source : HCR, portail des données opérationnelles, situation RD Congo, relevés du 31 mars et du 30 avril 2026.
Table compiled by James Wabenga Yango.Tableau composé par James Wabenga Yango.How to citeComment citer
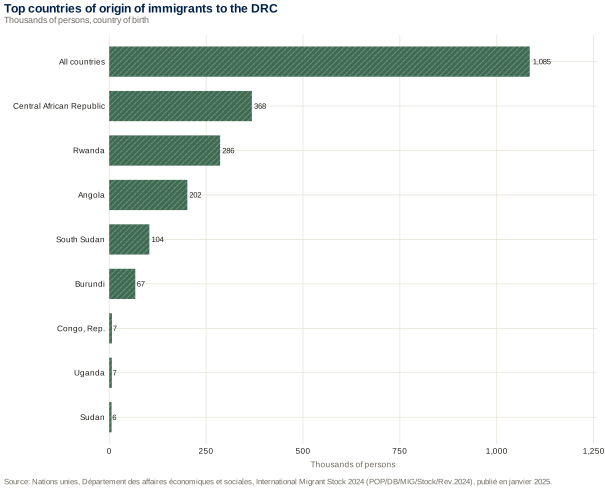
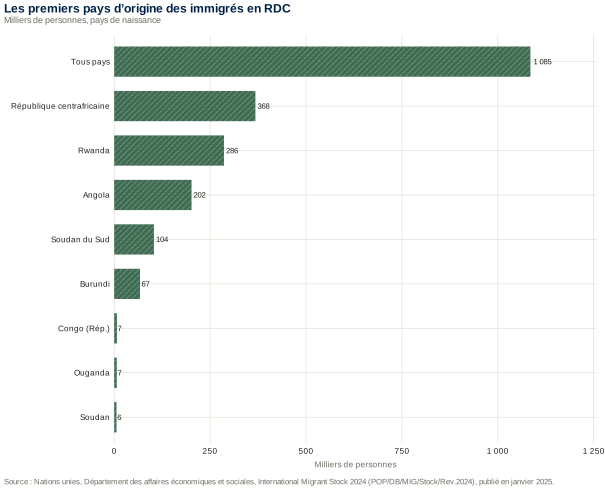
Foreign-born people living in the DRC, 2024Personnes nées à l’étranger vivant en RD Congo, 2024
Figure by James Wabenga Yango. Source: Nations unies, Département des affaires économiques et sociales, International Migrant Stock 2024 (POP/DB/MIG/Stock/Rev.2024), publié en janvier 2025.Figure de James Wabenga Yango. Source : Nations unies, Département des affaires économiques et sociales, International Migrant Stock 2024 (POP/DB/MIG/Stock/Rev.2024), publié en janvier 2025.How to citeComment citer
The DRC receives as well as sends. One and a nine tenths million foreign-born residents is about one per cent of the population, and 51.8 per cent of them are women. The stock fell from 754 thousand in 1990 to 590 thousand in 2010 before rising to its present level, which tracks the conflicts of the neighbours rather than any Congolese immigration policy. Against a diaspora of 2.10 million, the country is a net sender by roughly a million people.La RD Congo reçoit autant qu’elle envoie. Un million quatre-vingt-cinq mille résidents nés à l’étranger, c’est environ un pour cent de la population, et 51,8 pour cent d’entre eux sont des femmes. Le stock est tombé de 754 mille en 1990 à 590 mille en 2010 avant de remonter à son niveau actuel, ce qui suit les conflits des voisins plutôt qu’une quelconque politique congolaise d’immigration. Face à une diaspora de 2,10 millions, le pays est émetteur net d’environ un million de personnes.
Source:Source : Nations unies, Département des affaires économiques et sociales, International Migrant Stock 2024 (POP/DB/MIG/Stock/Rev.2024), publié en janvier 2025.
Table compiled by James Wabenga Yango.Tableau composé par James Wabenga Yango.How to citeComment citer
Internal migration: what is publishedMigration interne : ce qui est publié
ItemÉlément
ValueValeur
WhereOù
Inter-provincial migration matrixMatrice des migrations interprovinciales
Not publishedNon publiée
No census since 1984Aucun recensement depuis 1984
Residents who have not always lived in their locality, 2012Résidents n’ayant pas toujours vécu dans leur localité, 2012
Migrants who came from abroadMigrants venus de l’étranger
1,3 %1,3 %
Survey 1-2-3, phase 1Enquête 1-2-3, phase 1
Latest general population censusDernier recensement général de la population
19841984
Institut national de la statistiqueInstitut national de la statistique
Inter-provincial and intra-provincial migration is the clearest gap on this page, and it is worth being explicit about why. A migration matrix needs a census, and the last scientific census in the DRC was taken in 1984. The statistical institute’s portal was still marked as under construction in August 2026 and publishes no library; the Organization for Migration counts conflict displacement, which is a different thing and is set out in the security tab. What survives is the 1-2-3 survey of 2012, which asks whether a person has always lived where they now live: about one Congolese in five had not. That is a lifetime migration rate, not a flow, and it is fourteen years old. No matrix is constructed here from it, because none can honestly be.La migration interprovinciale et intraprovinciale est la lacune la plus nette de cette page, et il vaut la peine de dire pourquoi. Une matrice de migration demande un recensement, et le dernier recensement scientifique de la RD Congo date de 1984. Le portail de l’institut national de la statistique était encore annoncé comme en construction en août 2026 et ne publie aucune bibliothèque ; l’Organisation pour les migrations dénombre les déplacements liés au conflit, ce qui est autre chose et figure dans l’onglet sécurité. Il reste l’enquête 1-2-3 de 2012, qui demande si l’enquêté a toujours vécu là où il vit : environ un Congolais sur cinq n’y avait pas toujours vécu. C’est un taux de migration à vie, non un flux, et il a quatorze ans. Aucune matrice n’en est tirée ici, parce qu’aucune ne peut honnêtement l’être.
Source:Source : Kankwanda, Makabu, Nilsson, Roubaud, Torelli et Wachsberger, « Le marché du travail en République démocratique du Congo en 2012 : principaux résultats de la phase 1 de l’enquête 1-2-3 », DIAL-IRD, document de travail DT/2014-23, 2014, d’après l’enquête 1-2-3 de l’Institut national de la statistique.
Table compiled by James Wabenga Yango.Tableau composé par James Wabenga Yango.How to citeComment citer
How to cite this pageComment citer cette page
The tables and the plates of this section are compiled and drawn by the author from published sources. If one of them supports a piece of your own work (an article, a thesis, a report, a lecture, a slide), please cite it. The reference below covers the whole collection; the example further down shows how to point at a single figure or a single table.
Les tableaux et les planches de cette section sont composés et tracés par l’auteur à partir de sources publiées. Si l’un d’eux vient appuyer un travail (article, thèse, rapport, cours, diapositive), merci de le citer. La référence ci-dessous couvre l’ensemble ; l’exemple plus bas montre comment viser une figure ou un tableau en particulier.
BibTeXBibTeX
@misc{wabengayango2026drc,
  author       = {Wabenga Yango, James},
  title        = {Democratic Republic of the Congo: macroeconomic data,
                  figures and stylised facts},
  year         = {2026},
  version      = {August 2026},
  howpublished = {\url{https://jamwab.github.io}},
  url          = {https://jamwab.github.io/#drc},
  note         = {ORCID 0000-0002-4675-4583}
}
APA, seventh editionAPA, septième édition
Wabenga Yango, J. (2026). Democratic Republic of the Congo: macroeconomic
    data, figures and stylised facts (Version August 2026) [Data set].
    https://jamwab.github.io/#drc
Chicago, author–dateChicago, auteur-date
Wabenga Yango, James. 2026. "Democratic Republic of the Congo:
    Macroeconomic Data, Figures and Stylised Facts." Version August 2026.
    https://jamwab.github.io/#drc.
A single figure or tableUne figure ou un tableau en particulier
Each plate and each table carries an identifier, visible in the address bar once you follow its How to cite link. Append it to the address and add the title:
Chaque planche et chaque tableau porte un identifiant, lisible dans la barre d’adresse dès que l’on suit son renvoi Comment citer. Il suffit de l’ajouter à l’adresse, avec le titre :
Wabenga Yango, J. (2026). One cycle, five filters [Figure].
    https://jamwab.github.io/#fig-sf-filtres

Wabenga Yango, J. (2026). Business cycle moments, DR Congo [Table].
    https://jamwab.github.io/#tab-sf-moments
The date of consultation matters: the series are refreshed nightly and a figure read today may differ from the same figure read next month. Note the version, August 2026, or the day you consulted the page.La date de consultation compte : les séries sont actualisées chaque nuit et un chiffre lu aujourd’hui peut différer du même chiffre lu le mois prochain. Indiquez la version, août 2026, ou le jour de votre consultation.
NewsActualités
Latest newsDernières actualités
October 2026Octobre 2026
New working paper on SSRNNouveau document de travail sur SSRN
I am on the academic job market during the 2026–2027 hiring cycle. My CV is available under the About section; my research statement, teaching statement and other application materials are available on request.
Je suis sur le marché de l’emploi académique pour le cycle de recrutement 2026–2027. Mon CV est disponible sous la rubrique À propos ; mon exposé de projet de recherche, mon exposé de philosophie d’enseignement et mes autres documents de candidature sont disponibles sur demande.
September 2026Septembre 2026
Papers submitted to peer-reviewed journalsArticles soumis à des revues avec comité de lecture
The following papers are now under review:
Les articles suivants sont désormais en révision :
Titles marked “Submitted” on the Research page link to the working paper and abstract.
Les titres marqués « Soumis » sur la page Recherche renvoient au texte de travail et au résumé.
September 2026Septembre 2026
Revised working paper posted on SSRNTexte de travail révisé mis en ligne sur SSRN
A revised version of “Artificial Intelligence, Aging, and the Macroeconomy” is now available on SSRN (IDEAS); see the abstract on the Research page.
Une version révisée de « Artificial Intelligence, Aging, and the Macroeconomy » est disponible sur SSRN (IDEAS) ; le résumé figure sur la page Recherche.
—
Conferences and presentationsConférences et présentations
Upcoming conference presentations, seminars and workshop participations will be announced here as they are confirmed.
Les présentations à venir, séminaires et participations à des ateliers ou conférences seront annoncés ici au fur et à mesure de leur confirmation.